
All translations on this site are unofficial and provided for reference purpose only.
To view translations, select English under Step 1 (at the right of the screen). Not every item is (fully) translated. If you’re still seeing Chinese, you can use machine translation, under Step 2, to make sense of the rest.
Want to help translate? Switch to English under Step 1, and check ‘edit translation’ (more explanation in the FAQ). Even if you translate just a few lines, this is still very much appreciated! Remember to log in if you would like to be credited for your effort. If you’re unsure where to start translating, please see the list of Most wanted translations.
2017 Q1&2 wind power installations and production by province
Original title: 2017年上半年风电并网运行情况
Links: Original source (in Chinese) (link). Same stats for 2016 (link).
H1 2017 grid-connected wind power operation statistics
In the first half of 2017, nationwide newly installed grid-connected capacity of wind power was 6.01 GW, continuing to maintain a steady growth momentum. By the end of June, total installed grid-connected capacity was 154 GW, an increase of 12% on the same period last year;In the first half of 2017, wind power generation was 149 TWh, an increase of 21% on the same period last year;Average productivity was 984 full-load hours, an increase of 67 hours on the same period last year;Wind power curtailment was 23.5 TWh, down 9.1 TWh on the same period last year, showing a significant improvement in wind power curtailment。
In the first half of 2017, provinces that had relatively large capacity additions were Qinghai province (640 MW), Hebei (580 MW), Henan (580 MW) and Jiangxi (520 MW)。Provinces with relatively high wind farm productivity were Yunnan (1592 full-load hours), Sichuan (1498 hours), Fujian (1225 hours) and Tianjin (1208 hours);Provinces with relatively low wind farm productivity were Guangdong (584 full-load hours), Gansu (681 hours), Ningxia (804 hours) and Hainan (848 hours)。
H1 2017 grid-connected wind power operation statistics
| Province | New grid-connected capacity (MW) | Total grid-connected capacity (MW) | Power generation (GWh) | Wind power curtailment (GWh) | Wind power curtailment rate (%) | Full load hours |
| Total | 6,010 | 153,550 | 149,000 | 23,500 | 13.60% | 984 |
| Beijing | 3 | 190 | 200 | 1,026 | ||
| Tianjin | 280 | 300 | 1,208 | |||
| Hebei | 580 | 11,730 | 13,300 | 1,160 | 8% | 1,145 |
| Shanxi | 250 | 8,040 | 7,800 | 940 | 11% | 979 |
| Shandong | 390 | 8,990 | 8,700 | 0 | 998 | |
| Inner Mongolia | 140 | 26,110 | 26,700 | 5,030 | 16% | 1,023 |
| Liaoning | 6,960 | 7,800 | 750 | 9% | 1,124 | |
| Jilin | 5,050 | 4,300 | 1,380 | 24% | 853 | |
| Heilongjiang | 260 | 5,680 | 5,200 | 1,030 | 16% | 925 |
| Shanghai | 710 | 800 | 1,128 | |||
| Jiangsu | 290 | 5,810 | 5,800 | 1,007 | ||
| Zhejiang | 60 | 1,290 | 1,100 | 933 | ||
| Anhui | 10 | 1,950 | 2,000 | 1,023 | ||
| Fujian | 190 | 2,300 | 2,800 | 1,225 | ||
| Jiangxi | 520 | 1,620 | 1,400 | 898 | ||
| Henan | 580 | 1,750 | 1,300 | 862 | ||
| Hubei | 320 | 2,300 | 2,200 | 1,007 | ||
| Hunan | 200 | 2,370 | 2,400 | 0 | 1,043 | |
| Chongqing | 50 | 330 | 300 | 1,047 | ||
| Sichuan | 270 | 1,420 | 2,000 | 1,498 | ||
| Shaanxi | 410 | 2,190 | 1,700 | 130 | 7% | 903 |
| Gansu | 12,770 | 8,700 | 4,950 | 36% | 681 | |
| Qinghai | 640 | 820 | 800 | 997 | ||
| Ningxia | 9,420 | 7,600 | 350 | 4% | 804 | |
| Xinjiang | 300 | 18,060 | 15,300 | 7,250 | 32% | 854 |
| Tibet | 10 | 10 | 956 | |||
| Guangdong | 80 | 2,960 | 1,700 | 584 | ||
| Guangxi | 290 | 1,120 | 1,100 | 1,169 | ||
| Hainan | 310 | 300 | 0 | 848 | ||
| Guizhou | 3,620 | 3,400 | 1,028 | |||
| Yunnan | 150 | 7,420 | 11,800 | 560 | 5% | 1,592 |
Notes:1. Statistics as reported by the China Electricity Council and as dispatched by the grid companies;
2. Statistics for Shaanxi do not include data from Shaanxi District Electric Power (Group) Company。
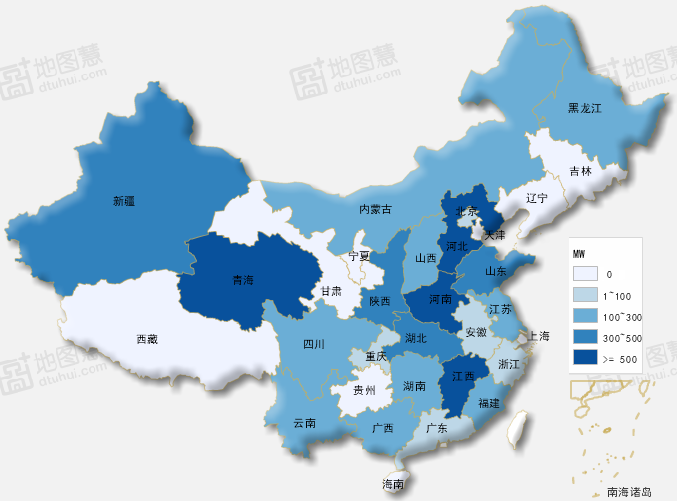
[Map added by China Energy Portal, created on dituhui.com (link).]


