
All translations on this site are unofficial and provided for reference purpose only.
To view translations, select English under Step 1 (at the right of the screen). Not every item is (fully) translated. If you’re still seeing Chinese, you can use machine translation, under Step 2, to make sense of the rest.
Want to help translate? Switch to English under Step 1, and check ‘edit translation’ (more explanation in the FAQ). Even if you translate just a few lines, this is still very much appreciated! Remember to log in if you would like to be credited for your effort. If you’re unsure where to start translating, please see the list of Most wanted translations.
Circular on 2023 risk and early warning for coal power planning and construction
Original title: 国家能源局关于发布2023年煤电规划建设风险预警的通知
Links: Source document (in Chinese) (link). Same document for other years: (2023) (2022) (2021) (2020).
National Energy Administration
Circular on 2023 risk and early warning for coal power planning and construction
NEA Power generation〔2020〕No. 12
To the energy bureaus of provinces, autonomous regions, directly-controlled municipalities, and the Xinjiang Production and Construction Corps, and the Development and Reform Commission of relevant provinces (directly-controlled municipalities), and the various local branches of these organizations, to the China Electricity Council, State Grid Corporation of China, China Southern Power Grid Co., Ltd., China Huaneng Group Corporation, China Datang Group Corporation, China Huadian Corporation, National Energy Investment Corporation, National Power Investment Corporation, China International Engineering Consulting Corporation, and the General Electric Power Planning and Design Institute:
In order to implement the requirements of the risk and early warning for coal power planning and construction mechanism as stipulated in the national coal-fired power development policy, to strengthen the ability to guarantee the supply of electricity and heat, to better guide local and power generation enterprises to orderly approve and build coal-fired power projects for local consumption of electricity within the respective province, the results of the 2023 risk and early warning for coal power planning and construction monitor are hereby published, and you are hereby notified of relevant matters as follows。
1. The risk and early warning indicator system for coal-fired power planning and construction is divided into indicators for economics, redundancy of installed capacity, and resource constraint indicators。Of these, the indicator for redundancy of installed coal-fired capacity is a binding indicator, which reflects the local overcapacity of coal-fired power generation capacity and power supply;the resource constraint indicator is a binding indicator, reflecting the local feasibility of planning and building coal-fired power projects;the economics indicator of coal power construction is a guiding indicator, which reflects the local economics of building coal-fired power projects for local power consumption, and provides decision-making reference for planning and construction of coal power projects。
2. The early warning indicator for the sufficiency of installed capacity of coal-fired power is based on the 2023 power system backup rate in different provinces, autonomous regions, or directly-controlled municipalities, and is divided into three levels of red, orange, and green。A red warning is issued when there is obvious redundancy in the installed capacity of coal-fired power, and the power system backup rate is exceedingly high;an orange warning is issued when the installed capacity of coal-fired power is abundant, and the power system backup rate is leaning towards being high;a green warning is issued when power supply and demand are basically balanced or if there is a shortage, and the power system backup rate is appropriate or relatively low。The reference levels for backup rates and the early warning results for each province, autonomous region, and directly-controlled municipality are shown in Annexes 1 and 2。
3. The resource constraint indicator is based on constraints in terms of emissions of pollutants to air, of water resources, of total coal consumption, and other related resources in each province, autonomous region, or municipality. The indicator is divided into two levels, red or green。For the areas identified in the "Notice on the Three year plan of action for winning the war to protect blue skies" (State Council [2018] No. 22) as key areas, a red warning is issued for the resource constraint indicator;the rest is green。The resource constraints results for each province, autonomous region, and directly-controlled municipality are shown in Annex 3。
4. The early warning indicator for the economics of coal-fired power construction is based on the expected return on investment of new coal-fired power projects with intended consumption of power within the respective province, autonomous region and directly-controlled municipality in 2023, and is divided into three levels: red, orange, and green。A red warning is issued when return on investment is lower than the current interest rate on medium to long-term national bonds;an orange warning is issued when return on investment is between the current interest rate on medium to long-term national bonds and a normal rate of return (generally 8% for power generation projects);a green warning is issued when return on investment exceeds the normal rate of return。For the calculation method and early warning results for expected return on investment for coal-fired power generation projects, see Annex 4 and 5。
5. In the case of major changes in the power supply and demand situation, of coal prices, of electricity prices, of other key conditions, or the introduction of relevant major policies, the NEA will update the risk and early warning results in a timely manner and issue revised annexes。
Notice is hereby given。
Annex:1. Reference level backup rates for provinces, autonomous regions, and directly-controlled municipalities
2. 2023 Redundancy of installed generation capacity
3. 2023 Resource constraint indicator
4. Calculation method for expected return on investment for coal-fired power generation projects
5. 2023 economics early warning indicator
National Energy Administration
11 February 2020
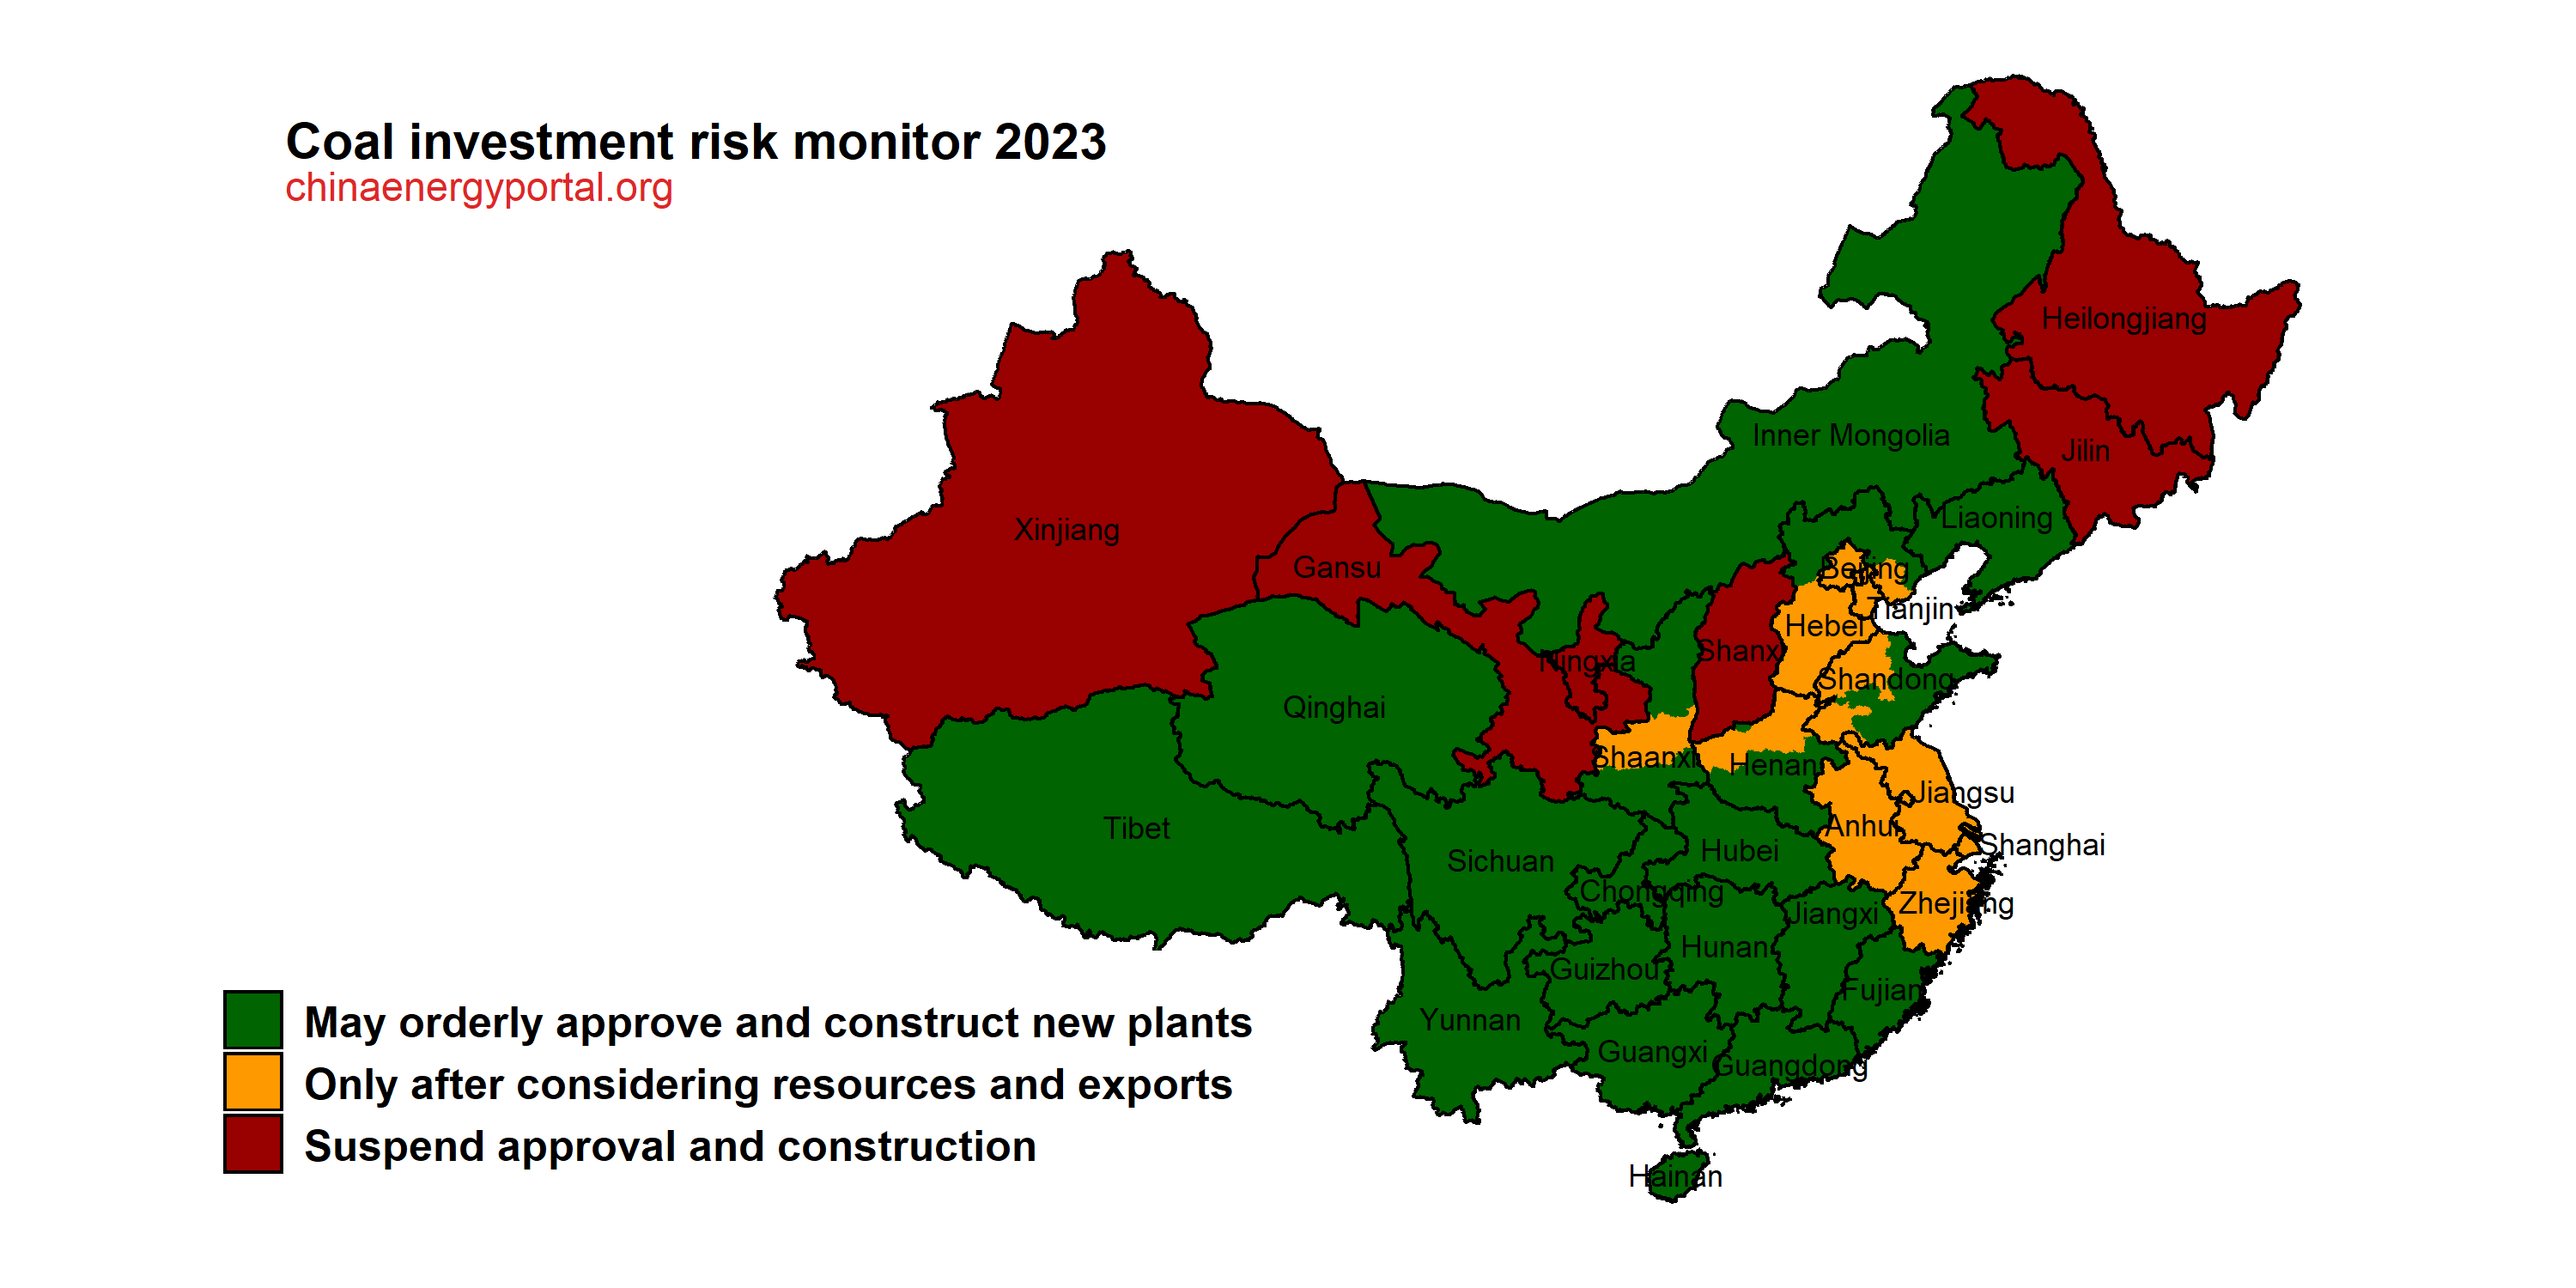
Results for 2023 risk and early warning for coal power planning and construction
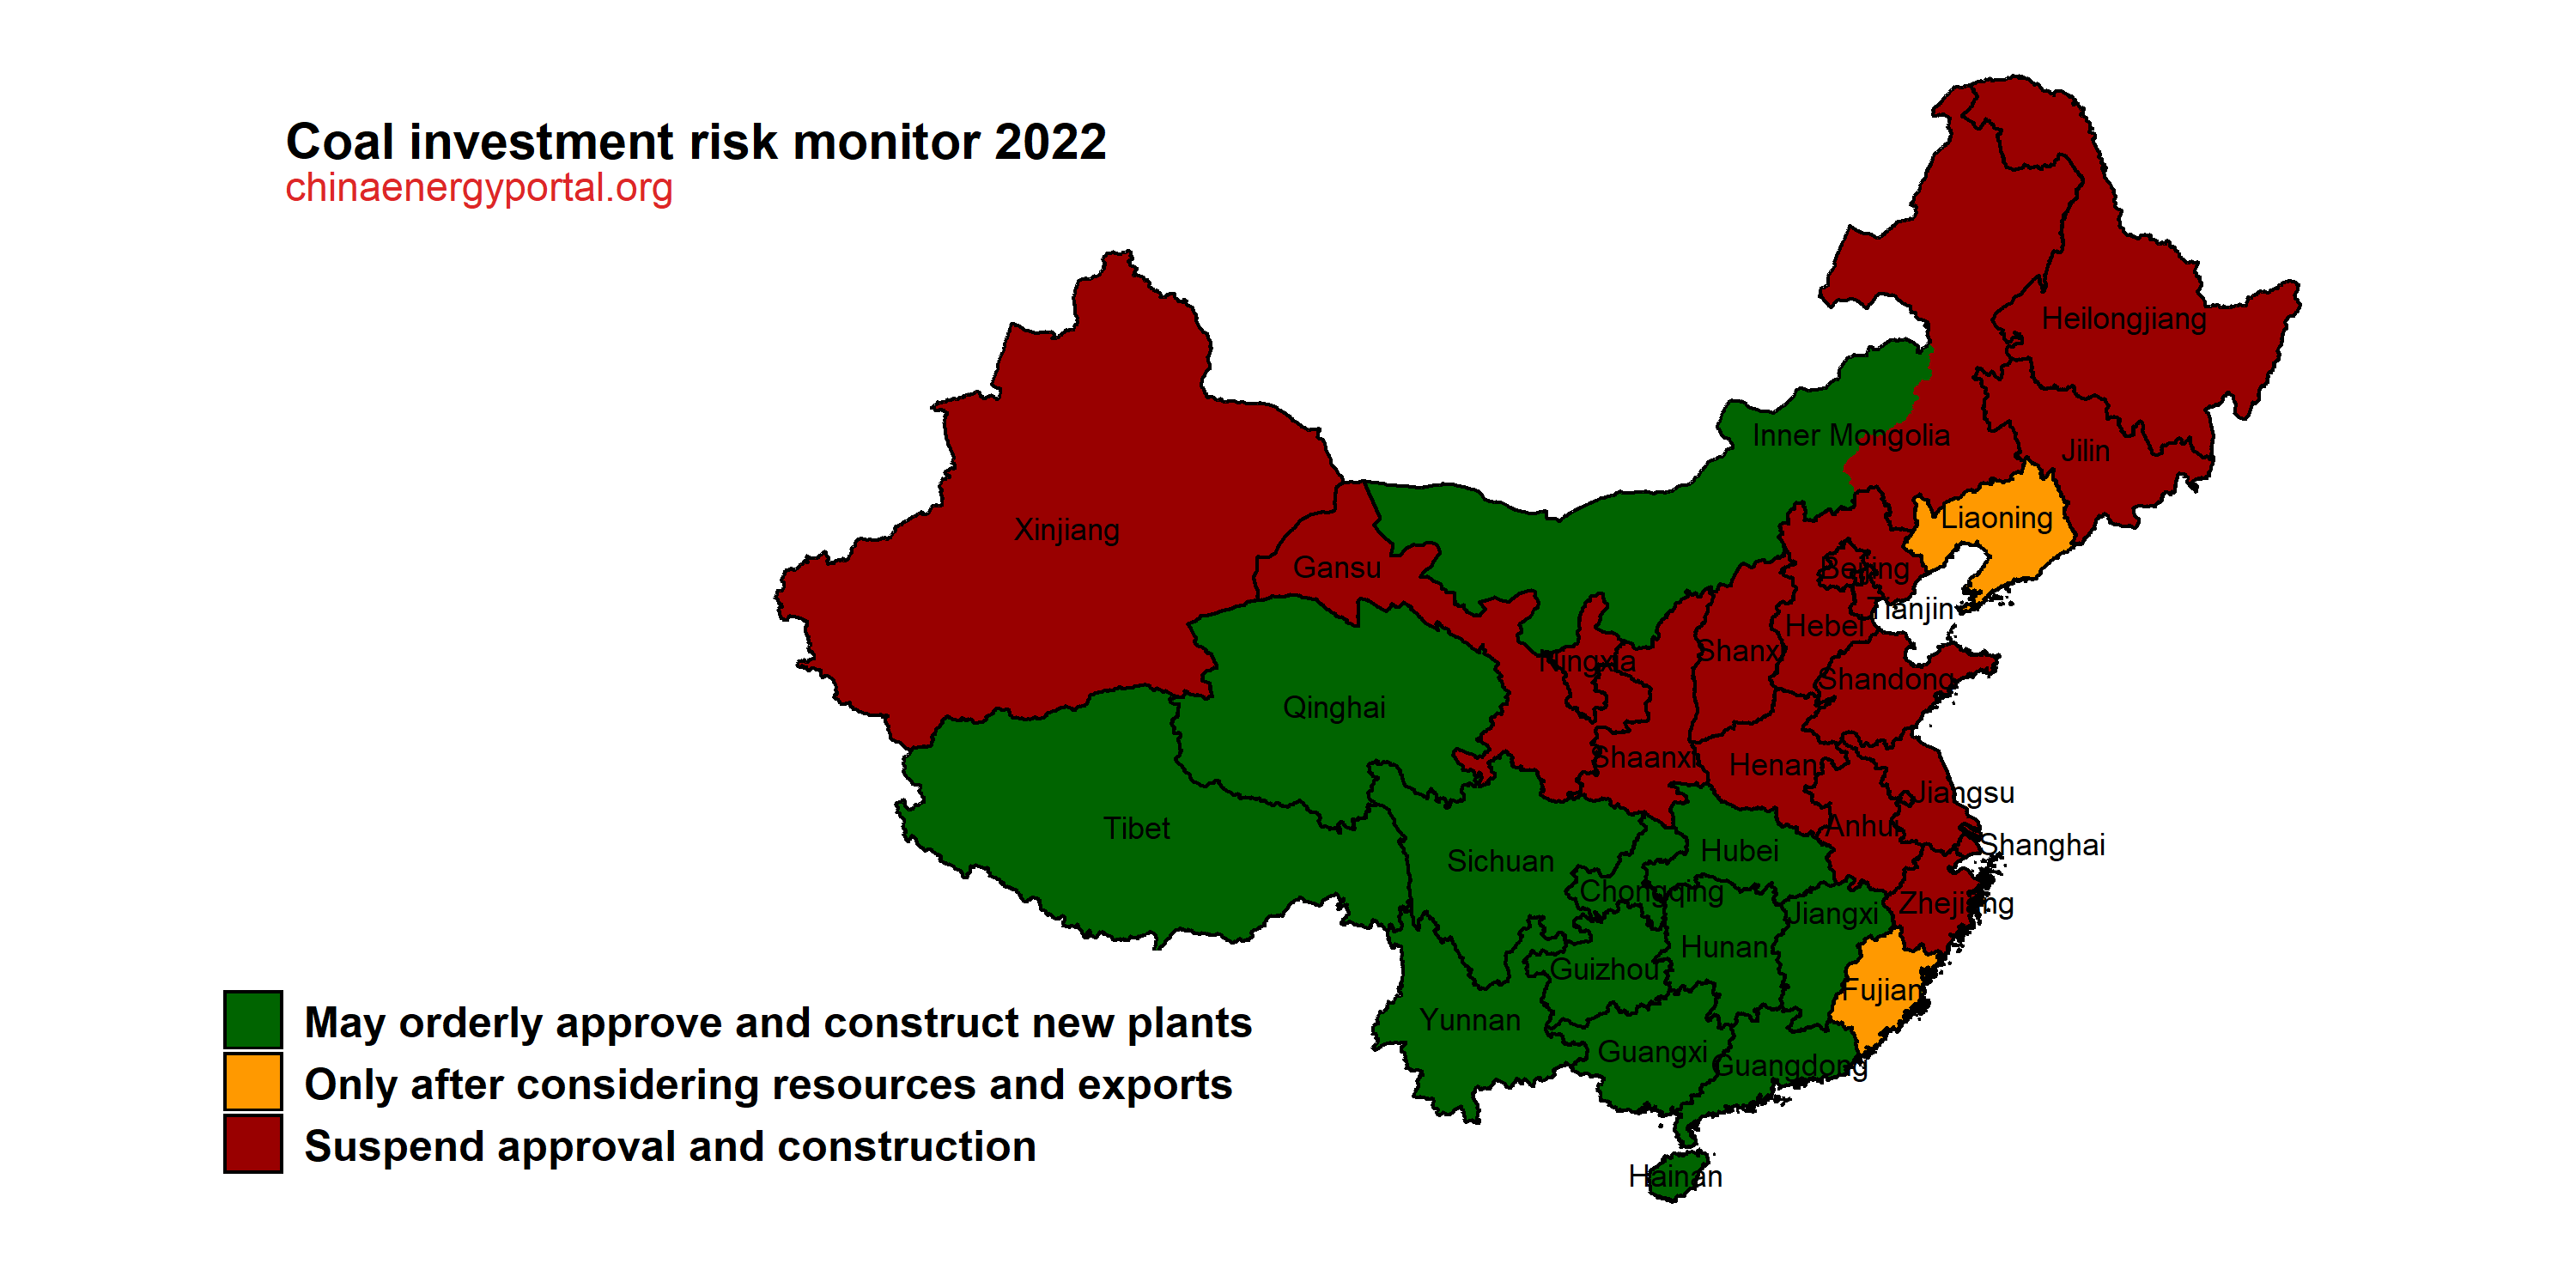
Results for last year
[Maps added by China Energy Portal, for method see the 2021 version (link)]
Annex 1
Reference level backup rates for provinces, autonomous regions, and directly-controlled municipalities
| No. | Area | Reasonable backup rate | Green zone | Orange zone | Red zone | ||
| 1 | Heilongjiang | 13% | ≤15% | 15-16% | >16% | ||
| 2 | Jilin | 13% | ≤15% | 15-17% | ≥17% | ||
| 3 | Liaoning | 13% | ≤14% | 14-17% | ≥17% | ||
| 4 | Inner Mongolia | Inner Mongolia (East) | 15% | ≤19% | 19-20% | ≥20% | |
| 5 | Inner Mongolia (West) | 15% | ≤16% | 16-21% | ≥21% | ||
| 6 | Beijing | 15% | – | – | – | ||
| 7 | Tianjin | 15% | ≤19% | 19-20% | ≥20% | ||
| 8 | Hebei | Northern Hebei | 13% | ≤15% | 15-17% | ≥17% | |
| 9 | Southern Hebei | 13% | ≤14% | 14-18% | ≥18% | ||
| 10 | Shandong | 13% | ≤14% | 14-17% | ≥17% | ||
| 11 | Shanxi | 13% | ≤15% | 15-19% | ≥19% | ||
| 12 | Shaanxi | 13% | ≤15% | 15-18% | ≥18% | ||
| 11 | Gansu | 13% | ≤15% | 15-18% | ≥18% | ||
| 14 | Qinghai | 13% | ≤16% | 16-18% | ≥18% | ||
| 15 | Ningxia | 15% | ≤18% | 18-20% | ≥20% | ||
| 16 | Xinjiang | 15% | ≤17% | 17-22% | ≥22% | ||
| 17 | Henan | 14% | ≤15% | 15-19% | ≥19% | ||
| 18 | Hubei | 14% | ≤16% | 16-20% | ≥20% | ||
| 19 | Hunan | 14% | ≤16% | 16-20% | ≥20% | ||
| 20 | Jiangxi | 14% | ≤16% | 16-22% | ≥22% | ||
| 21 | Sichuan | 14% | ≤15% | 15-19% | ≥19% | ||
| 22 | Chongqing | 15% | ≤17% | 17-21% | ≥21% | ||
| 23 | Tibet | – | – | – | – | ||
| 24 | Shanghai | 15% | ≤17% | 17-18% | ≥18% | ||
| 25 | Jiangsu | 12% | ≤13% | 13-17% | ≥17% | ||
| 26 | Zhejiang | 12% | ≤13% | 13-17% | ≥17% | ||
| 27 | Anhui | 12% | ≤14% | 14-18% | ≥18% | ||
| 28 | Fujian | 12% | ≤14% | 14-18% | ≥18% | ||
| 29 | Guangdong | 13% | ≤14% | 14-18% | ≥18% | ||
| 30 | Guangxi | 13% | ≤15% | 15-17% | ≥17% | ||
| 31 | Yunnan | 13% | ≤14% | 14-20% | ≥20% | ||
| 32 | Guizhou | 13% | ≤15% | 15-20% | ≥20% | ||
| 33 | Hainan | 20% | ≤25% | 25-29% | ≥29% | ||
Note:
Green zone:The actual power system backup rate is not higher than the reasonable backup rate, or does not exceed the reasonable backup rate by more than the equivalent of a single local large-scale coal-fired power generation unit;
Red zone:The actual power system backup rate exceeds the reasonable backup rate by the equivalent of more than the local demand growth in a single year;
Orange zone:The actual power system backup rate is between the red and green zones。
Annex 2
2023 Redundancy of installed generation capacity
| No. | Area | Early warning indicator for the redundancy of installed capacity of coal-fired power | No. | Area | Early warning indicator for the redundancy of installed capacity of coal-fired power | |
| 1 | Heilongjiang | Orange | 18 | Hubei | Green | |
| 2 | Jilin | Orange | 19 | Hunan | Green | |
| 3 | Liaoning | Green | 20 | Jiangxi | Green | |
| 4 | Inner Mongolia | Inner Mongolia (East) | Green | 21 | Sichuan | Green |
| 5 | Inner Mongolia (West) | Green | 22 | Chongqing | Green | |
| 6 | Beijing | — | 23 | Tibet | — | |
| 7 | Tianjin | Green | 24 | Shanghai | Green | |
| 8 | Hebei | Northern Hebei | Green | 25 | Jiangsu | Green |
| 9 | Southern Hebei | Green | 26 | Zhejiang | Green | |
| 10 | Shandong | Green | 27 | Anhui | Green | |
| 11 | Shanxi | Red | 28 | Fujian | Green | |
| 12 | Shaanxi | Green | 29 | Guangdong | Green | |
| 11 | Gansu | Red | 30 | Guangxi | Green | |
| 14 | Qinghai | Green | 31 | Yunnan | Green | |
| 15 | Ningxia | Red | 32 | Guizhou | Green | |
| 16 | Xinjiang | Orange | 33 | Hainan | Green | |
| 17 | Henan | Green | ||||
Annex 3
2023 Resource constraint indicator
| No. | Area | Resource constraint indicator | No. | Area | Resource constraint indicator | |||
| 1 | Heilongjiang | Green | 16 | Xinjiang | Green | |||
| 2 | Jilin | Green | 17 | Henan | Key areas | Red | ||
| 3 | Liaoning | Green | Other areas | Green | ||||
| 4 | Inner Mongolia | Inner Mongolia (East) | Green | 18 | Hubei | Green | ||
| 5 | Inner Mongolia (West) | Green | 19 | Hunan | Green | |||
| 6 | Beijing | Red | 20 | Jiangxi | Green | |||
| 7 | Tianjin | Red | 21 | Sichuan | Green | |||
| 8 | Hebei | Northern Hebei | Key areas | Red | 22 | Chongqing | Green | |
| Other areas | Green | 23 | Tibet | Green | ||||
| 9 | Southern Hebei | Red | 24 | Shanghai | Red | |||
| 10 | Shandong | Key areas | Red | 25 | Jiangsu | Red | ||
| Other areas | Green | 26 | Zhejiang | Red | ||||
| 11 | Shanxi | Key areas | Red | 27 | Anhui | Red | ||
| Other areas | Green | 28 | Fujian | Green | ||||
| 12 | Shaanxi | Key areas | Red | 29 | Guangdong | Green | ||
| Other areas | Green | 30 | Guangxi | Green | ||||
| 11 | Gansu | Green | 31 | Yunnan | Green | |||
| 14 | Qinghai | Green | 32 | Guizhou | Green | |||
| 15 | Ningxia | Green | 33 | Hainan | Green | |||
Note:"Key areas" refers to the areas identified in the "Notice on the Three year plan of action for winning the war to protect blue skies" (State Council [2018] No. 22) as such。
Annex 4
Calculation method for expected return on investment for coal-fired power generation projects
klr = [(P–Rca×Pca/106) Tv / CE– (kzj+r×kll+kcb)]/ (1-r)
In which, klr:Return on capital investment for coal-fired power project;
P:Coal-fired power project's electricity price (excluding tax) (in RMB/kWh);
CE:Dynamic investment per kilowatt (in RMB/kW);
Tv:Expected annual utilization hours (unit: hours);
kzj:Depreciation rate; using a 20 years depreciation period, use 5%;
r:Share of loans in total investment; generally 80% for power projects;
kll:Interest rate on the loans;
kcb:Operating cost rate; ratio of total annual operating costs versus total investment, including maintenance costs, wages, benefits and insurance for personnel, material costs, other costs, etc.。ForKcbtake 2.5% as a benchmark for preliminary calculation of the rate of return on investment for a typical coal-fired power project;Then, enter this preliminary rate of return on investment into the formula:Kcb=0.0737×preliminary rate of return on investment calculated for the project+0.0118,so as to generate a suitable recommended value forKcbfor a specific project。
Rca:Coal consumption of the generation unit (in g/kWh);
Pca:Expected standard coal price (in RMB/ton, including tax). Determine by reference to China's coal price index the past three years (converted to standard coal eq. at 7,000 kcal/kg) and by weighting with 0.5, 0.3 and 0.2, respectively, for the most recent to the last year included in the reference
Annex 5
2023 economics early warning indicator
| No. | Area | Early warning indicator for the economics of coal-fired power construction | No. | Area | Early warning indicator for the economics of coal-fired power construction | |
| 1 | Heilongjiang | Green | 18 | Hubei | Green | |
| 2 | Jilin | Red | 19 | Hunan | Green | |
| 3 | Liaoning | Red | 20 | Jiangxi | Red | |
| 4 | Inner Mongolia | Inner Mongolia (East) | Green | 21 | Sichuan | Red |
| 5 | Inner Mongolia (West) | Green | 22 | Chongqing | Green | |
| 6 | Beijing | — | 23 | Tibet | — | |
| 7 | Tianjin | Red | 24 | Shanghai | Green | |
| 8 | Hebei | Northern Hebei | Green | 25 | Jiangsu | Green |
| 9 | Southern Hebei | Green | 26 | Zhejiang | Green | |
| 10 | Shandong | Green | 27 | Anhui | Green | |
| 11 | Shanxi | Green | 28 | Fujian | Green | |
| 12 | Shaanxi | Green | 29 | Guangdong | Green | |
| 11 | Gansu | Red | 30 | Guangxi | Red | |
| 14 | Qinghai | Red | 31 | Yunnan | Red | |
| 15 | Ningxia | Red | 32 | Guizhou | Green | |
| 16 | Xinjiang | Green | 33 | Hainan | Green | |
| 17 | Henan | Orange | ||||


