
All translations on this site are unofficial and provided for reference purpose only.
To view translations, select English under Step 1 (at the right of the screen). Not every item is (fully) translated. If you’re still seeing Chinese, you can use machine translation, under Step 2, to make sense of the rest.
Want to help translate? Switch to English under Step 1, and check ‘edit translation’ (more explanation in the FAQ). Even if you translate just a few lines, this is still very much appreciated! Remember to log in if you would like to be credited for your effort. If you’re unsure where to start translating, please see the list of Most wanted translations.
2016 National electricity price supervision report
Original title: 2016年度全国电力价格情况监管通报
Links: Source document (in Chinese) (link).
2016 National electricity price supervision report
In order to fully disseminate the production cost of electricity, price information and changes in different areas nationwide, to better implement cost and price supervision, and to effectively maintain an orderly electricity market, the National Energy Administration organized a statistical analysis of electricity prices of major power companies throughout the country in 2016, and created this report。
1. Overall own use consumption rate for power plants
In 2016, the overall own use consumption rate for power plants of power generation enterprises nationwide was 5.57%, a year-on-year decrease of 0.03 percentage points。It was the highest in biomass power generation, at 11.88%, and the lowest hydroelectric power generation, at 0.97%。
(i) Coal-fired units
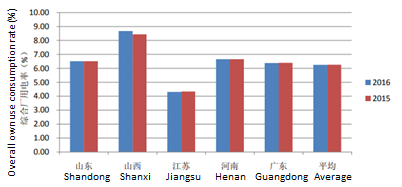
Nationally (excluding Tibet, the same below), the average own use consumption rate of coal-fired power plants in 2016 was 6.74%, up by 0.02 percentage points compared with last year。it was the highest in the Eastern part of Inner Mongolia, at 9.96%, and the lowest in Jiangsu, at 4.31%。For details, see supplementary Table 1-1。
Looking at the five key provinces* of Shandong, Shanxi, Jiangsu, Henan and Guangdong, the overall own use consumption rate for power plants in 2016 was 6.25%, down by 0.01 percentage points on the previous year。Amongst these, it was the highest in Shanxi, at 8.67 percent, and the lowest in Jiangsu, at 4.31%。See Figure 1-1。
[* The five key provinces are the top 5 provinces that generated the highest volume of power with the type of generating unit referred to in the statistics here, the same below。]
Figure 1-1. Average own use consumption rate of coal-fired power plants in key provinces
(ii) Hydropower units
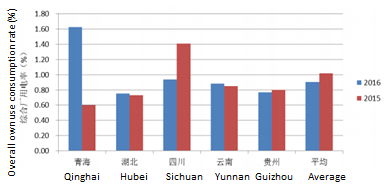
Nationally, the average own use consumption rate of hydropower plants in 2016 was 0.97%, down by 0.09 percentage points compared with last year。It was the highest in Henan, at 2.94%, and the lowest in Fujian, at 0.36%。For details, see supplementary Table 1-1。
Looking at the five key provinces of Qinghai, Hubei, Sichuan, Yunnan, and Guizhou, the overall own use consumption rate for power plants in 2016 was 0.90%, down by 0.12 percentage points on the previous year。Amongst these, it was the highest in Qinghai, at 1.62%, and the lowest in Hubei, at 0.75%。See Figure 1-2。
Figure 1-2. Average own use consumption rate of hydropower plants in key provinces
(iii) Wind power generation units
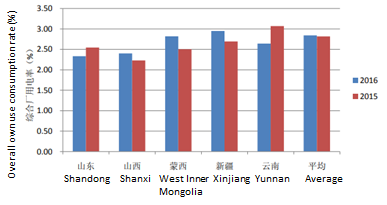
Nationally, the average own use consumption rate of wind power plants in 2016 was 2.90%, down by 0.1 percentage points compared with last year。It was the highest in Hubei, at 4.45%, and the lowest in Shaanxi, at 0.95%。For details, see supplementary Table 1-2。
Looking at the five key provinces of Shandong, Shanxi, West Inner Mongolia, Xinjiang and Yunnan, the overall own use consumption rate for power plants in 2016 was 2.84%, down by 0.02 percentage points on the previous year。Amongst these, it was the highest in Xinjiang, at 2.95%, and the lowest in Shandong, at 2.33%。See Figure 1-3。
Figure 1-3. Average own use consumption rate of wind power generation units in key provinces (regions)
(iv) Other power generation units
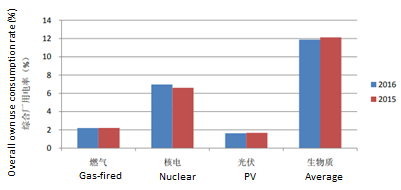
Nationally, the average own use consumption rate of gas-fired, PV, and biomass power generation power plants in 2016 was 2.20%, 1.62%, and 11.88%, respectively, with decreases of 0.01, 0,02, and 0.04 percentage points on last year, respectively. The average own use consumption rate of nuclear power plants was 6.97%, an increase of 0.36 percentage points compared with last year。See Figure 1-4。
Figure 1-4. Average own use consumption rate of other power generation units
The average own use consumption rate for gas-fired power generation, nuclear power generation, photovoltaic power generation, and biomass power generation in each province (region, directly-controlled municipality) is shown in Supplementary Table 1-1 and 1-2。
2. Average feed-in electricity price (including tax, the same below)
In 2016, the nationwide average feed-in electricity price for power generation enterprises was 370.97 CNY/MWh, which was a year-on-year decrease of 7.42%。The highest price was for photovoltaic power generation, at 918.12 CNY/MWh, and the lowest for hydropower, at 265.81 CNY/MWh。
(i) Coal-fired units
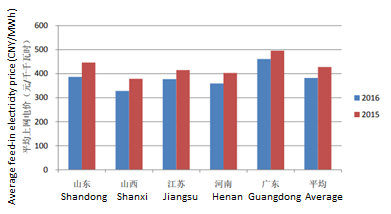
Nationwide, the average feed-in electricity price for coal-fired units in 2016 was 362.08 CNY/MWh, which was a year-on-year decrease of 10.13%。It was the highest in Guangdong at 460.87 CNY/MWh, and the lowest in Xinjiang, at 224.78 CNY/MWh。For details see Supplementary Table 2-1。Looking at the five key provinces of Shandong, Shanxi, Jiangsu, Henan, and Guangdong, the average feed-in electricity price in 2016 was 381.98 CNY/MWh, which was a decrease of 10.73% year-on-year。It was the highest in Guangdong, at 460.87 CNY/MWh, and the lowest in Shanxi, at 328.13 CNY/MWh。See Figure 2-1。
Figure 2-1. Average feed-in electricity price for coal-fired units in key provinces
(ii) Hydropower units
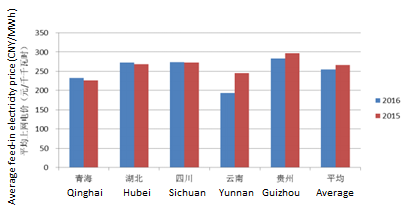
Nationwide, the average feed-in electricity price for hydropower units in 2016 was 265.81 CNY/MWh, which was a year-on-year decrease of 3.41%。It was the highest in Zhejiang, at 566.84 CNY/MWh, and the lowest in Yunnan, at 193.10 CNY/MWh。For details see Supplementary Table 2-1。In the five key provinces of Qinghai, Hubei, Sichuan, Yunnan, and Guizhou, the average feed-in electricity price in 2016 was 254.57 CNY/MWh, which was a decrease of 4.24% year-on-year. It was the highest in Guizhou, at 283.46 CNY/MWh, and the lowest in Yunnan, at 193.10 CNY/MWh。See Figure 2-2。
Figure 2-2. Average feed-in electricity price for hydropower units in key provinces
(iii) Wind power generation units
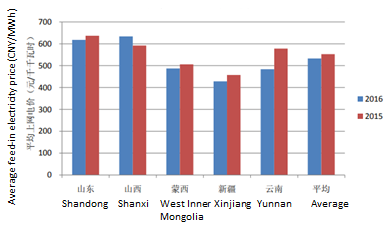
Nationwide, the average feed-in electricity price for wind power generation units in 2016 was 566.98 CNY/MWh, which was a year-on-year decrease of 1.22%。It was the highest in Beijing, at 749.27 CNY/MWh, and the lowest in Xinjiang, at 428.09 CNY/MWh。For details see Supplementary Table 2-2。Looking at the five key provinces (regions) of Shandong, Shanxi, West Inner Mongolia, Xinjiang, and Yunnan, the average feed-in electricity price in 2016 was 532.85 CNY/MWh, which was 3.63% lower than the same period of last year. It was the highest in Shanxi, at 634.02 CMY/MWh, and the lowest in Xinjiang, at 428,09 CNY/MWh。See Figure 2-3。
Figure 2-3. Average feed-in electricity price for wind power generation units in key provinces (regions)
(iv) Other power generation units
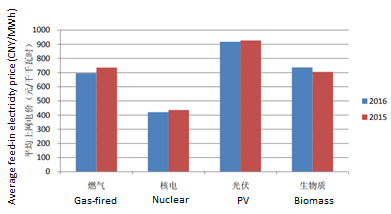
Nationally, the average feed-in electricity price for gas-fired, nuclear, and photovoltaic power generation in 2016 were 695.17 CNY/MWh, 420.89 CNY/MWh, and 918.12 CNY/MWh, respectively, a decrease of 5.42%, 3.41%, and 0.93% on last year;The average feed-in electricity price for biomass power generation was 736.82 CNY/MWh, which was an increase of 4.51% on last year。See Figure 2-4。
Figure 2-4. Average feed-in electricity price for other power generation units
For details on the average feed-in electricity prices for gas-fired power generation, nuclear power generation, photovoltaic power generation, and biomass power generation in each province (region, directly-controlled municipality), see Supplementary Tables 2-1 and 2-2。
3. Line loss rates*
In 2016, the average line loss rate for grid companies was 6.66%, up 0.51 percentage points on last year。
Looking at individual companies, China Southern Power Grid Company had the highest line loss rate, at 6.77%, and the Inner Mongolia Electric Power Company had the lowest, at 4,04%。See Table 1。
[*The data of some power grid companies in 2015 are inconsistent with the data of the “2015 National Electricity Price Supervision Report”; the current report uses data from the grid company's 2015 annual financial statements。]
Table 1. Line loss rate statistics by grid company
Unit:%
|
Item |
State Grid Corporation |
China Southern Power Grid Company |
Inner Mongolia Electric Power Company |
Average |
| 2016 | 6.73 | 6.77 | 4.04 | 6.66 |
| 2015 | 6.06 | 6.87 | 4.35 | 6.15 |
| Increase | 0.67 | -0.10 | -0.31 | 0.51 |
| Increase (%) | 11.13 | -1.49 | -7.24 | 8.17 |
Looking at individual provinces (autonomous regions, directly-controlled municipalities), Hunan had the highest line loss rates, at 8.72%, and Ningxia had the lowest, at 2.89%。For details, see supplementary Table 3。
4. Average purchase and sales price difference (excluding tax, the same below)
In 2016, the average purchase and sales price difference (including line losses) for power grid companies was 219.22 CNY/MWh, a year-on-year increase of 0.74%;excluding line losses, the average purchase and sales price difference for power grid companies was 197.38 CNY/MWh, a yea-on-year increase of 0.81%。
Looking at individual companies, the average purchase and sales price difference (including line loss) was the highest for the State Grid Corporation, at 222.78 CNY/MWh, and the lowest for the Inner Mongolia Electric Power Company, at 118.10 CNY/MWh。See Table 2。
Looking at individual provinces (autonomous regions, directly-controlled municipalities), the average purchase and sales price difference (including line loss) was the highest in Shanghai, at 242.55 CNY/MWh, and the lowest in Ningxia, at 96.50 CNY/MWh。For details, see supplementary Table 4。
Table 2. Average purchase and sales price difference (excluding tax) statistics, by power grid company
Unit:CNY/MWh
|
Item |
State Grid Corporation |
China Southern Power Grid Company |
Inner Mongolia Electric Power Company |
Average |
|
|
Purchase and sales price difference (including line losses) |
2016 | 222.78 | 222.12 | 118.10 | 219.22 |
| 2015 | 218.55 | 229.84 | 126.39 | 217.62 | |
| Increase | 4.23 | -7.72 | -8.29 | 1.60 | |
| Increase (%) | 1.94 | -3.36 | -6.56 | 0.74 | |
|
Purchase and sales price difference (excluding line losses) |
2016 | 200.70 | 199.95 | 109.34 | 197.38 |
| 2015 | 196.99 | 205.14 | 115.33 | 195.79 | |
| Increase | 3.71 | -5.19 | -5.99 | 1.59 | |
| Increase (%) | 1.88 | -2.53 | -5.20 | 0.81 | |
5. Average sales price (including tax, the same below)
In 2016, the average electricity sales price for the power grid companies was 614.83 CNY/MWh, down 4.55% on last year。
Looking at individual companies, the China Southern Power Grid had the highest average electricity sales price, at 640.11 CNY/MWh, and the Inner Mongolia Electric Power Company had the lowest, at 381.76 CNY/MWh。
See Table 3。
Table 3. Average electricity sales price statistics, by grid company
Unit:CNY/MWh
|
Item |
State Grid Corporation |
China Southern Power Grid Company |
Inner Mongolia Electric Power Company |
Average |
| 2016 | 618.49 | 640.11 | 381.76 | 614.83 |
| 2015 | 646.73 | 669.91 | 432.21 | 644.16 |
| Increase | -28.24 | -29.8 | -50.45 | -29.33 |
| Increase (%) | -4.37 | -4.45 | -11.67 | -4.55 |
Note:Excluding government funds or surcharges; including taxes。
Looking at individual provinces (autonomous regions, directly-controlled municipalities), the average electricity sales price was the highest in Shenzhen, at 784.70 CNY/MWh, and the lowest in Ningxia, at 353.67 CNY/MWh。For details, see supplementary Table 5。
Looking at the different electricity rates, the average electricity price was the highest for general industry and commerce, etc., at 817.44 CNY/MWh;the electricity price for large-scale industry was 645.65 CNY/MWh;the average residential electricity rate (incl. distribution) was 548.00 CNY/MWh。See Figure 3。
Figure 3. Comparison of different electricity rates
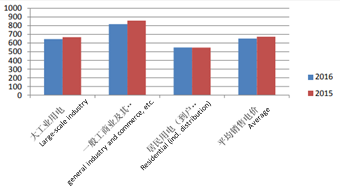
Note:The electricity rates are the weighted average of the State Grid Corporation and China Southern Power Grid Corporation。
Looking at individual provinces (autonomous regions, directly-controlled municipalities) (or regions), the average electricity rate for residential users was the highest in Shenzhen, at 716.11 CNY/MWh, and the lowest in Qinghai, at 404.00 CNY/MWh。For details, see supplementary Table 5。
6. Government fund levies and surcharges (including tax, the same below)
In 2016, the national average of [levies for] government funds and surcharges levied on the electricity sales price was 46.45 CNY/MWh (determined as the average value of power sales by grid companies within a province, the same below), an increase of 18.43% on last year。
There are five main types of government funds and surcharges: the Major Water Conservancy Project Construction Fund, the Rural Power Grid Repayment Fund, the Support Fund for Relocation after Reservoir construction, the Renewable Energy Development Fund, and the Urban Public Utility Surcharge (Cancelled April 2017)。
Looking at individual provinces (autonomous regions, directly-controlled municipalities), the average [levies for] government funds and surcharges are the highest in Chongqing, at 68.54 CNY/MWh, and the lowest in Xinjiang, at 6.81 CNY/MWh。For details, see supplementary Table 6。
(This article has been deleted)
Annex:1. Overall own use consumption rate for power plants
2. Average electricity feed-in price for power generation enterprises
3. Power grid company line loss rate statistics
4. Average electricity purchase and sales price differences (excluding tax) for power grid companies
5. Power grid companies' average electricity sales price and average residential electricity prices
6. Grid companies' average collection of government funds and surcharges
Supplementary Table 1-1. Overall own use consumption rate for power plants
Unit:%
|
Area |
Coal fired | Gas | Hydro power | |||
| 2016 | 2015 | 2016 | 2015 | 2016 | 2015 | |
| National average | 6.74 | 6.72 | 2.2 | 2.21 | 0.97 | 1.06 |
| Beijing | – | – | 2.41 | 2.38 | – | – |
| Tianjin | 7.81 | 7.26 | 2.58 | 2.67 | – | – |
| Hebei | 7.54 | 7.34 | – | – | – | – |
| Shandong | 6.51 | 6.51 | – | – | – | – |
| Shanxi | 8.67 | 8.44 | 2.7 | 3.06 | 1.86 | 1.97 |
| Inner Mongolia (East) | 9.96 | 9.26 | – | – | 2.4 | 2.37 |
| Inner Mongolia (West) | 8.33 | 7.95 | – | – | 1.15 | 1.04 |
| Liaoning | 8.23 | 8.14 | – | – | 2.78 | 4.64 |
| Jilin | 9.36 | 9.82 | – | – | 1.15 | 1.17 |
| Heilongjiang | 8.62 | 8.78 | – | – | 1.92 | 2.25 |
| Shaanxi | 8.18 | 7.96 | – | – | 1.54 | 1.45 |
| Gansu | 7.79 | 8.07 | – | – | 2.27 | 1.73 |
| Ningxia | 8.08 | 7.47 | – | – | 2.57 | 2.60 |
| Qinghai | 7.11 | 10.48 | – | – | 1.62 | 0.60 |
| Xinjiang | 8.33 | 8.24 | – | – | 1.27 | 1.24 |
| Shanghai | 5.15 | 5.09 | 2.62 | 2.48 | – | – |
| Jiangsu | 4.31 | 4.34 | 1.56 | 1.55 | 0.40 | 0.76 |
| Zhejiang | 6.05 | 6.12 | 2.67 | 2.62 | 1.12 | 1.23 |
| Anhui | 4.95 | 4.96 | – | – | 1.69 | 1.80 |
| Fujian | 6.05 | 5.88 | 1.84 | 1.80 | 0.36 | 0.49 |
| Hubei | 5.9 | 5.89 | 3.07 | 3.92 | 0.75 | 0.73 |
| Hunan | 6.48 | 6.59 | – | – | 1.40 | 1.47 |
| Henan | 6.65 | 6.66 | 2.08 | 2.03 | 2.94 | 2.55 |
| Jiangxi | 4.94 | 5.02 | – | – | 1.37 | 1.75 |
| Sichuan | 7.10 | 7.20 | 2.50 | 2.30 | 0.94 | 1.41 |
| Chongqing | 6.67 | 6.86 | 2.61 | 2.82 | 0.82 | 0.80 |
| Guangdong | 6.38 | 6.4 | 2.02 | 2.12 | 1.31 | 1.80 |
| Guangxi | 8.58 | 8.16 | 3.28 | 2.63 | 0.86 | 0.82 |
| Yunnan | 8.31 | 7.95 | – | – | 0.88 | 0.85 |
| Guizhou | 8.32 | 8.60 | – | – | 0.77 | 0.80 |
| Hainan | 6.75 | 6.84 | 3.07 | 2.57 | 0.76 | 0.90 |
Note:Overall own use consumption rate = (power generation - power delivered to the grid)/power generation。
2. These statistics exclude Tibet, the same below。
3. Due to changes in statistical methods and sample size, some of the 2015 data are different from data in last year's report; the same below。
Supplementary Table 1-2. Overall own use consumption rate for power plants
Unit:%
|
Area |
Wind power | Nuclear power | PV | Biomass power | ||||
| 2016 | 2015 | 2016 | 2015 | 2016 | 2015 | 2016 | 2015 | |
| National
Average |
2.9 |
3.00 |
6.97 |
6.61 |
1.62 |
1.67 |
11.88 |
12.12 |
| Beijing | 1.31 | 3.43 | – | – | – | – | – | – |
| Tianjin | 2.34 | 2.47 | – | – | – | – | – | – |
| Hebei | 2.83 | 3.52 | – | – | 1.85 | 1.23 | – | – |
| Shandong | 2.33 | 2.54 | – | – | 2.12 | 0.91 | – | – |
| Shanxi | 2.40 | 2.23 | – | – | 1.01 | 2.82 | – | – |
| Inner Mongolia (East) | 2.55 | 3.88 | – | – | 1.05 | 1.30 | 1.26 | 1.14 |
| Inner Mongolia (West) | 2.82 | 2.50 | – | – | 1.82 | 2.21 | – | – |
| Liaoning | 3.23 | 3.13 | 8.98 | 9.55 | 2.95 | 1.04 | 15.85 | 15.19 |
| Jilin | 4.43 | 4.28 | – | – | 5.29 | – | 8.12 | 7.52 |
| Heilongjiang | 4.16 | 3.16 | – | – | 2.46 | – | 13.43 | – |
| Shaanxi | 0.95 | 1.33 | – | – | 1.38 | 1.47 | – | – |
| Gansu | 3.65 | 3.97 | – | – | 1.68 | 1.26 | 8.14 | 10.00 |
| Ningxia | 3.69 | 3.51 | – | – | 2.2 | 2.08 | – | – |
| Qinghai | 1.96 | 1.67 | – | – | 1.89 | 1.86 | – | – |
| Xinjiang | 2.95 | 2.69 | – | – | 2.04 | 2.10 | – | – |
| Shanghai | 3.46 | 3.74 | – | – | – | – | 12.03 | 12.97 |
| Jiangsu | 2.41 | 2.52 | 6.37 | 6.36 | 0.14 | 0.42 | 11.15 | 11.49 |
| Zhejiang | – | – | 6.13 | 6.11 | 0.99 | 0.67 | – | – |
| Anhui | 2.31 | 2.33 | – | – | 0.45 | – | – | – |
| Fujian | 2.48 | 2.38 | 8.94 | 8.74 | 0.86 | – | – | – |
| Hubei | 4.45 | 4.44 | – | – | 1.60 | 1.30 | 17.81 | 16.89 |
| Hunan | 3.29 | 3.77 | – | – | 5.25 | – | 11.29 | 10.94 |
| Henan | 3.14 | 3.09 | – | – | – | – | – | – |
| Jiangxi | 3.25 | 2.80 | – | – | 1.04 | 1.19 | 8.40 | 9.61 |
| Sichuan | 2.88 | 3.23 | – | – | 1.76 | 1.28 | 13.55 | 14.53 |
| Chongqing | 3.26 | 3.27 | – | – | – | – | 15.55 | 15.52 |
| Guangdong | 4.25 | 3.64 | 5.4 | 5.15 | 2.08 | 5.62 | 5.39 | 5.43 |
| Guangxi | 2.42 | 1.70 | 7.47 | – | – | – | – | – |
| Yunnan | 2.64 | 3.07 | – | – | 1.70 | 3.38 | 22.05 | 21.88 |
| Guizhou | 2.45 | 2.53 | – | – | 1.16 | 1.00 | – | – |
| Hainan | 4.10 | 3.77 | 9.29 | – | 2.23 | 2.06 | – | – |
Note:Overall own use consumption rate = (power generation - power delivered to the grid)/power generation。
2. Statistics for PV do not include distributed PV, the same below。
Supplementary Table 2-1. Average electricity feed-in price for power generation enterprises
Unit:CNY/MWh, %
|
Area |
Coal fired | Gas | Hydro power | ||||||
| 2016 | 2015 | Increase (%) | 2016 | 2015 | Increase (%) | 2016 | 2015 | Increase (%) | |
| National
Average |
362.08 |
402.91 |
-10.13 |
695.17 |
735.03 |
-5.42 |
265.81 |
275.19 |
-3.41 |
| Beijing | 454.99 | 480.70 | -5.35 | 732.37 | 735.51 | -0.43 | – | – | – |
| Tianjin | 385.63 | 408.47 | -5.59 | 719.09 | 758.91 | -5.25 | – | – | – |
| Hebei | 363.07 | 402.65 | -9.83 | – | – | – | – | – | – |
| Shandong | 386.52 | 446.36 | -13.41 | – | – | – | – | – | – |
| Shanxi | 328.13 | 378.38 | -13.28 | 675.33 | 704.44 | -4.13 | 226.67 | 348.76 | -35.01 |
| Inner Mongolia (East) | 293.72 | 300.91 | -2.39 | – | – | – | 384.70 | 383.75 | 0.25 |
| Inner Mongolia (West) | 262.09 | 304.84 | -14.02 | – | – | – | 350.32 | 447.63 | -21.74 |
| Liaoning | 351.46 | 376.49 | -6.65 | – | – | – | 254.23 | 632.23 | -59.79 |
| Jilin | 349.77 | 372.28 | -6.05 | – | – | – | 253.92 | 293.68 | -13.54 |
| Heilongjiang | 362.07 | 377.61 | -4.11 | – | – | – | 413.98 | 405.79 | 2.02 |
| Shaanxi | 325.93 | 379.05 | -14.01 | – | – | – | 315.01 | 306.46 | 2.79 |
| Gansu | 242.60 | 295.69 | -17.96 | – | – | – | 264.51 | 256.01 | 3.32 |
| Ningxia | 253.86 | 282.59 | -10.17 | – | – | – | 318.69 | 263.86 | 20.78 |
| Qinghai | 258.25 | 313.17 | -17.54 | – | – | – | 232.50 | 226.58 | 2.61 |
| Xinjiang | 224.78 | 252.31 | -10.91 | – | – | – | 252.20 | 248.18 | 1.62 |
| Shanghai | 400.46 | 437.96 | -8.56 | 814.76 | 845.68 | -3.66 | – | – | – |
| Jiangsu | 377.22 | 414.95 | -9.09 | 642.38 | 736.83 | -12.82 | – | – | – |
| Zhejiang | 411.53 | 460.60 | -10.65 | 837.86 | 977.44 | -14.28 | 566.84 | 544.68 | 4.07 |
| Anhui | 357.31 | 383.19 | -6.75 | – | – | – | 447.73 | 444.56 | 0.71 |
| Fujian | 354.22 | 395.86 | -10.52 | 586.28 | 581.69 | 0.79 | 350.83 | 353.47 | -0.75 |
| Hubei | 394.92 | 451.01 | -12.44 | 770.78 | 877.04 | -12.12 | 272.06 | 268.62 | 1.28 |
| Hunan | 448.51 | 481.46 | -6.84 | – | – | – | 357.99 | 358.30 | -0.09 |
| Henan | 358.91 | 402.97 | -10.93 | 627.74 | 655.76 | -4.27 | 311.11 | 336.79 | -7.62 |
| Jiangxi | 398.63 | 441.14 | -9.64 | – | – | – | 357.77 | 363.19 | -1.49 |
| Sichuan | 455.03 | 460.92 | -1.28 | 490.43 | 485.56 | 1.00 | 273.28 | 272.09 | 0.44 |
| Chongqing | 380.53 | 424.05 | -10.26 | 649.71 | 871.87 | -25.48 | 318.96 | 320.52 | -0.49 |
| Guangdong | 460.87 | 495.71 | -7.03 | 656.53 | 645.07 | 1.78 | 345.15 | 347.36 | -0.64 |
| Guangxi | 382.65 | 439.27 | -12.89 | 596.00 | 950.00 | -37.26 | 276.22 | 277.47 | -0.45 |
| Yunnan | 407.06 | 441.36 | -7.77 | – | – | – | 193.10 | 244.79 | -21.11 |
| Guizhou | 299.69 | 365.10 | -17.92 | – | – | – | 283.46 | 296.34 | -4.35 |
| Hainan | 393.56 | 426.62 | -7.75 | 625.94 | 577.24 | 8.44 | 408.17 | 366.62 | 11.33 |
Note:Average electricity feed-in price = electricity sales revenue /(amount of power put on to the grid × 1.17); including tax。
Supplementary Table 2-2. Average electricity feed-in price for power generation enterprises
Unit:CNY/MWh, %
|
Area |
Wind power | Nuclear power | PV | Biomass power | ||||||||
| 2016 | 2015 | Increase (%) | 2016 | 2015 | Increase (%) | 2016 | 2015 | Increase (%) | 2016 | 2015 | Increase (%) | |
| National
Average |
566.98 |
573.99 |
-1.22 |
420.89 |
435.76 |
-3.41 |
918.12 |
926.72 |
-0.93 |
736.82 |
705.05 |
4.51 |
| Beijing | 749.27 | 752.04 | -0.37 | – | – | – | – | – | – | – | – | – |
| Tianjin | 620.64 | 616.48 | 0.68 | – | – | – | – | – | – | – | – | – |
| Hebei | 545.78 | 544.49 | 0.24 | – | – | – | 1204.29 | 1289.83 | -6.63 | – | – | – |
| Shandong | 617.81 | 636.83 | -2.99 | – | – | – | 978.14 | 919.38 | 6.39 | – | – | – |
| Shanxi | 634.02 | 592.17 | 7.07 | – | – | – | 963.27 | 856.30 | 12.49 | – | – | – |
| Inner Mongolia (East) | 545.64 | 553.10 | -1.35 | – | – | – | 854.56 | 949.95 | -10.04 | 747.17 | 714.14 | 4.62 |
| Inner Mongolia (West) | 487.24 | 506.01 | -3.71 | – | – | – | 968.38 | 877.62 | 10.34 | – | – | – |
| Liaoning | 601.35 | 593.14 | 1.39 | 386.16 | 411.09 | -6.06 | 710.91 | 1015.30 | -29.98 | 741.95 | 740.51 | 0.20 |
| Jilin | 612.57 | 637.89 | -3.97 | – | – | – | 941.61 | – | – | 746.01 | 746.27 | -0.03 |
| Heilongjiang | 618.81 | 610.42 | 1.38 | – | – | – | 668.93 | 1023.75 | -34.66 | 559.50 | – | – |
| Shaanxi | 605.70 | 584.49 | 3.63 | – | – | – | 491.19 | 381.30 | 28.82 | – | – | – |
| Gansu | 535.64 | 594.95 | -9.97 | – | – | – | 896.96 | 921.44 | -2.66 | 555.38 | 744.55 | -25.41 |
| Ningxia | 658.17 | 584.46 | 12.61 | – | – | – | 765.71 | 818.07 | -6.40 | – | – | – |
| Qinghai | 609.10 | 458.84 | 32.75 | – | – | – | 788.15 | 841.01 | -6.29 | – | – | – |
| Xinjiang | 428.09 | 457.20 | -6.37 | – | – | – | 822.61 | 847.07 | -2.89 | – | – | – |
| Shanghai | 724.73 | 739.34 | -1.98 | – | – | – | 2008.79 | 1999.87 | 0.45 | 705.50 | 656.55 | 7.46 |
| Jiangsu | 620.86 | 605.35 | 2.56 | 452.71 | 453.98 | -0.28 | 1319.68 | 1329.69 | -0.75 | 753.87 | 742.37 | 1.55 |
| Zhejiang | – | – | – | 414.04 | 428.23 | -3.31 | 1088.10 | 1021.34 | 6.54 | – | – | – |
| Anhui | 607.84 | 610.04 | -0.36 | – | – | – | 1005.14 | 1000.00 | 0.51 | – | – | – |
| Fujian | 600.96 | 574.11 | 4.68 | 422.61 | 430.09 | -1.74 | 990.37 | – | – | – | – | – |
| Hubei | 612.98 | 637.60 | -3.86 | – | – | – | 1021.60 | 1040.64 | -1.83 | 707.56 | 664.21 | 6.53 |
| Hunan | 588.86 | 551.89 | 6.70 | – | – | – | 925.64 | – | – | 750.06 | 742.44 | 1.03 |
| Henan | 583.62 | 613.51 | -4.87 | – | – | – | – | – | – | – | – | – |
| Jiangxi | 607.94 | 609.68 | -0.29 | – | – | – | 1022.23 | 992.18 | 3.03 | 747.81 | 750.00 | -0.29 |
| Sichuan | 544.90 | 645.98 | -15.65 | – | – | – | 829.49 | 951.76 | -12.85 | 780.39 | 648.94 | 20.26 |
| Chongqing | 608.11 | 611.16 | -0.50 | – | – | – | – | – | – | 651.94 | 644.69 | 1.12 |
| Guangdong | 609.48 | 604.45 | 0.83 | 433.45 | 440.95 | -1.70 | 742.55 | 701.99 | 5.78 | 748.03 | 707.71 | 5.70 |
| Guangxi | 611.04 | 603.67 | 1.22 | 369.41 | – | – | – | – | – | – | – | – |
| Yunnan | 483.58 | 577.97 | -16.33 | – | – | – | 896.03 | 970.85 | -7.71 | 662.69 | 674.39 | -1.73 |
| Guizhou | 603.65 | 606.01 | -0.39 | – | – | – | 1011.33 | – | – | – | – | – |
| Hainan | 618.81 | 601.03 | 2.96 | 390.05 | – | – | 513.05 | 495.10 | 3.63 | – | – | – |
Note:Average electricity feed-in price = electricity sales revenue /(amount of power put on to the grid × 1.17); including tax。
Supplementary Table 3. Power grid company line loss rate statistics
Unit:%
| Area | 2016 | 2015 |
| National average | 6.66 | 6.15 |
| Beijing | 6.45 | 6.70 |
| Tianjin | 6.87 | 6.46 |
| Hebei (north grid) | 5.77 | 3.59 |
| Hebei (south grid) | 7.84 | 8.00 |
| Shandong | 5.65 | 4.83 |
| Shanxi | 4.85 | 4.04 |
| Inner Mongolia (East) | 6.85 | 6.60 |
| Inner Mongolia (West) | 4.04 | 4.35 |
| Liaoning | 6.13 | 6.00 |
| Jilin | 7.03 | 7.29 |
| Heilongjiang | 5.70 | 5.39 |
| Shaanxi | 5.83 | 5.58 |
| Gansu | 5.78 | 5.13 |
| Ningxia | 2.89 | 1.50 |
| Qinghai | 3.34 | 1.42 |
| Xinjiang | 7.26 | 5.94 |
| Shanghai | 5.97 | 6.06 |
| Jiangsu | 3.87 | 4.28 |
| Zhejiang | 4.15 | 4.20 |
| Anhui | 7.00 | 6.39 |
| Fujian | 4.73 | 4.63 |
| Hubei | 6.79 | 6.58 |
| Henan | 8.57 | 7.99 |
| Hunan | 8.72 | 8.10 |
| Jiangxi | 6.92 | 6.57 |
| Sichuan | 6.67 | 6.40 |
| Chongqing | 6.97 | 6.84 |
| Guangdong | 3.25 | 3.61 |
| Guangxi | 5.66 | 3.93 |
| Yunnan | 5.97 | 6.59 |
| Guizhou | 5.07 | 4.73 |
| Hainan | 7.33 | 7.23 |
| Guangzhou | 3.98 | 3.94 |
| Shenzhen | 3.71 | 3.54 |
Supplementary Table 4. Average electricity purchase and sales price differences (excluding tax) for power grid companies
Unit:CNY/MWh, %
|
Area |
Purchase and sales price difference (incl. line losses) | Purchase and sales price difference (excl. line losses) | ||||
| 2016 | 2015 | Increase (%) | 2016 | 2015 | Increase (%) | |
| National average | 219.22 | 217.62 | 0.74 | 197.38 | 195.79 | 0.81 |
| Beijing | 209.48 | 207.88 | 0.77 | 178.80 | 175.11 | 2.11 |
| Tianjin | 221.95 | 216.70 | 2.42 | 193.60 | 188.88 | 2.50 |
| Hebei (north grid) | 164.02 | 158.06 | 3.77 | 144.24 | 145.20 | -0.66 |
| Hebei (south grid) | 208.76 | 210.21 | -0.69 | 182.56 | 180.50 | 1.14 |
| Shandong | 222.12 | 221.48 | 0.29 | 202.55 | 202.42 | 0.06 |
| Shanxi | 130.73 | 131.69 | -0.73 | 116.84 | 118.62 | -1.50 |
| Inner Mongolia (East) | 208.84 | 200.97 | 3.91 | 190.91 | 183.92 | 3.80 |
| Inner Mongolia (West) | 118.10 | 126.39 | -6.56 | 109.34 | 115.33 | -5.20 |
| Liaoning | 200.93 | 200.30 | 0.31 | 180.88 | 179.55 | 0.74 |
| Jilin | 211.81 | 213.39 | -0.74 | 188.30 | 187.61 | 0.37 |
| Heilongjiang | 135.74 | 134.21 | 1.14 | 116.77 | 115.21 | 1.36 |
| Shaanxi | 153.72 | 164.17 | -6.37 | 136.67 | 145.71 | -6.20 |
| Gansu | 153.85 | 156.04 | -1.41 | 141.78 | 143.48 | -1.18 |
| Ningxia | 96.50 | 100.21 | -3.70 | 90.34 | 96.60 | -6.48 |
| Qinghai | 117.42 | 112.58 | 4.30 | 110.69 | 106.10 | 4.33 |
| Xinjiang | 156.89 | 162.14 | -3.24 | 140.83 | 143.65 | -1.96 |
| Shanghai | 242.55 | 239.80 | 1.15 | 218.10 | 213.34 | 2.23 |
| Jiangsu | 226.89 | 211.13 | 7.46 | 212.97 | 201.13 | 5.89 |
| Zhejiang | 219.46 | 225.74 | -2.78 | 202.88 | 207.56 | -2.26 |
| Anhui | 217.47 | 238.18 | -8.69 | 192.97 | 214.61 | -10.08 |
| Fujian | 203.78 | 208.87 | -2.43 | 187.32 | 192.12 | -2.49 |
| Hubei | 228.73 | 228.34 | 0.17 | 205.30 | 203.92 | 0.68 |
| Henan | 201.71 | 180.36 | 11.84 | 170.33 | 150.77 | 12.97 |
| Hunan | 237.06 | 233.46 | 1.54 | 205.11 | 202.74 | 1.17 |
| Jiangxi | 240.94 | 251.25 | -4.10 | 216.22 | 225.81 | -4.25 |
| Sichuan | 201.33 | 196.72 | 2.34 | 184.05 | 178.84 | 2.91 |
| Chongqing | 229.10 | 236.84 | -3.27 | 206.44 | 213.32 | -3.23 |
| Guangdong | 173.89 | 172.40 | 0.87 | 155.83 | 151.32 | 2.98 |
| Guangxi | 168.71 | 164.33 | 2.66 | 149.17 | 141.96 | 5.08 |
| Yunnan | 133.24 | 136.33 | -2.26 | 121.40 | 120.64 | 0.63 |
| Guizhou | 124.90 | 130.33 | -4.17 | 110.92 | 115.86 | -4.27 |
| Hainan | 239.95 | 218.25 | 9.94 | 209.84 | 186.26 | 12.66 |
| Guangzhou | 187.77 | 191.11 | -1.75 | 168.95 | 171.95 | -1.75 |
| Shenzhen | 138.03 | 157.35 | -12.27 | 119.02 | 139.16 | -14.47 |
| State Grid Corporation (parent company) | 47.53 | 48.66 | -2.33 | 39.83 | 40.03 | -0.50 |
| China Southern Power Grid Company (parent company) | 71.89 | 73.34 | -1.98 | 57.23 | 57.12 | 0.19 |
Supplementary Table 5. Power grid companies' average electricity sales price and average residential electricity prices
Unit:CNY/MWh, %
|
Area |
Average electricity sales price | Average residential electricity prices | ||||
| 2016 | 2015 | Increase (%) | 2016 | 2015 | Increase (%) | |
| National average | 614.83 | 644.16 | -4.55 | 548.00 | 546.74 | 0.23 |
| Beijing | 766.00 | 777.24 | -1.45 | 494.78 | 495.12 | -0.07 |
| Tianjin | 709.47 | 725.31 | -2.18 | 503.66 | 503.25 | 0.08 |
| Hebei (north grid) | 569.61 | 589.56 | -3.38 | 513.96 | 514.33 | -0.07 |
| Hebei (south grid) | 605.08 | 645.62 | -6.28 | 506.36 | 507.08 | -0.14 |
| Shandong | 641.77 | 698.38 | -8.11 | 538.60 | 536.71 | 0.35 |
| Shanxi | 472.52 | 517.21 | -8.64 | 491.94 | 493.20 | -0.25 |
| Inner Mongolia (East) | 524.77 | 513.20 | 2.25 | 508.11 | 507.03 | 0.21 |
| Inner Mongolia (West) | 381.76 | 432.21 | -11.67 | 436.24 | 434.79 | 0.33 |
| Liaoning | 592.85 | 613.06 | -3.30 | 513.38 | 512.38 | 0.20 |
| Jilin | 608.67 | 630.54 | -3.47 | 531.87 | 534.76 | -0.54 |
| Heilongjiang | 525.92 | 547.14 | -3.88 | 521.63 | 521.19 | 0.08 |
| Shaanxi | 501.87 | 557.01 | -9.90 | 506.30 | 507.07 | -0.15 |
| Gansu | 410.12 | 454.63 | -9.79 | 522.54 | 511.84 | 2.09 |
| Ningxia | 353.67 | 393.74 | -9.72 | 462.72 | 457.24 | 1.20 |
| Qinghai | 363.80 | 381.37 | -4.61 | 404.00 | 405.80 | -0.44 |
| Xinjiang | 402.03 | 440.90 | -8.82 | 530.93 | 533.57 | -0.49 |
| Shanghai | 734.55 | 760.34 | -3.39 | 572.92 | 571.25 | 0.29 |
| Jiangsu | 666.56 | 688.79 | -3.23 | 519.56 | 517.57 | 0.38 |
| Zhejiang | 704.39 | 747.25 | -5.74 | 558.94 | 556.10 | 0.51 |
| Anhui | 636.66 | 682.36 | -6.70 | 572.72 | 569.24 | 0.61 |
| Fujian | 626.65 | 648.30 | -3.34 | 557.15 | 551.49 | 1.03 |
| Hubei | 641.93 | 669.60 | -4.13 | 573.53 | 579.50 | -1.03 |
| Henan | 581.39 | 609.93 | -4.68 | 563.66 | 563.22 | 0.08 |
| Hunan | 668.46 | 681.25 | -1.88 | 607.81 | 607.02 | 0.13 |
| Jiangxi | 674.80 | 711.61 | -5.17 | 620.54 | 618.23 | 0.37 |
| Sichuan | 518.40 | 535.93 | -3.27 | 523.34 | 523.33 | 0.00 |
| Chongqing | 618.79 | 648.45 | -4.57 | 533.80 | 537.34 | -0.66 |
| Guangdong | 683.04 | 700.61 | -2.51 | 648.17 | 645.64 | 0.39 |
| Guangxi | 538.54 | 557.30 | -3.37 | 557.69 | 562.87 | -0.92 |
| Yunnan | 373.66 | 419.22 | -10.76 | 468.01 | 471.97 | -0.84 |
| Guizhou | 452.25 | 493.67 | -8.39 | 484.17 | 485.44 | -0.26 |
| Hainan | 725.39 | 734.24 | -1.21 | 632.30 | 632.06 | 0.04 |
| Guangzhou | 750.86 | 770.09 | -2.50 | 656.00 | 654.08 | 0.29 |
| Shenzhen | 784.70 | 807.88 | -2.87 | 716.11 | 714.62 | 0.21 |
| State Grid Corporation (parent company) | 368.53 | 398.93 | -7.62 | – | – | – |
| China Southern Power Grid Company (parent company) | 409.76 | 437.35 | -6.31 | – | – | – |
Supplementary Table 6. Grid companies' average collection of government funds and surcharges
Unit:CNY/MWh, %
| Area | 2016 | 2015 | Increase (%) |
| National average | 46.45 | 39.22 | 18.43 |
| Beijing | 46.10 | 50.04 | -7.87 |
| Tianjin | 59.17 | 55.96 | 5.74 |
| Hebei (north grid) | 37.09 | 33.81 | 9.70 |
| Hebei (south grid) | 41.82 | 29.14 | 43.49 |
| Shandong | 40.42 | 37.33 | 8.28 |
| Shanxi | 47.53 | 45.99 | 3.35 |
| Inner Mongolia (East) | 17.08 | 21.08 | -18.98 |
| Inner Mongolia (West) | 53.10 | 49.10 | 8.15 |
| Liaoning | 35.04 | 31.74 | 10.39 |
| Jilin | 48.12 | 45.38 | 6.04 |
| Heilongjiang | 26.26 | 23.87 | 10.01 |
| Shaanxi | 62.82 | 41.75 | 50.47 |
| Gansu | 24.36 | 20.93 | 16.39 |
| Ningxia | 24.90 | 21.77 | 14.36 |
| Qinghai | 25.20 | 21.60 | 16.67 |
| Xinjiang | 6.81 | 9.02 | -24.51 |
| Shanghai | 66.63 | 64.22 | 21.19 |
| Jiangsu | 51.56 | 41.74 | 23.53 |
| Zhejiang | 43.51 | 40.69 | 6.93 |
| Anhui | 47.10 | 42.38 | 41.10 |
| Fujian | 38.97 | 36.81 | 5.86 |
| Hubei | 47.44 | 45.10 | 5.19 |
| Henan | 36.66 | 37.04 | -1.03 |
| Hunan | 51.12 | 47.07 | 8.60 |
| Jiangxi | 39.00 | 27.69 | 40.85 |
| Sichuan | 44.97 | 44.59 | 0.84 |
| Chongqing | 68.54 | 65.20 | 5.12 |
| Guangdong | 43.51 | 40.86 | 6.49 |
| Guangxi | 45.06 | 42.05 | 7.16 |
| Yunnan | 23.19 | 25.30 | -8.34 |
| Guizhou | 31.34 | 29.23 | 7.22 |
| Hainan | 40.36 | 38.00 | 6.21 |
| Guangzhou | 44.99 | 40.77 | 10.36 |
| Shenzhen | 44.80 | 40.80 | 9.80 |


