
All translations on this site are unofficial and provided for reference purpose only.
To view translations, select English under Step 1 (at the right of the screen). Not every item is (fully) translated. If you’re still seeing Chinese, you can use machine translation, under Step 2, to make sense of the rest.
Want to help translate? Switch to English under Step 1, and check ‘edit translation’ (more explanation in the FAQ). Even if you translate just a few lines, this is still very much appreciated! Remember to log in if you would like to be credited for your effort. If you’re unsure where to start translating, please see the list of Most wanted translations.
2017 National renewable power development monitoring and evaluation report
Original title: 国家能源局关于2017年度全国可再生能源电力发展监测评价的通报 国能发新能〔2018〕43号
Links: Source document (in Chinese) (link). Same report for 2015 (link) and 2016 (link).
NEA notice on the 2017 National renewable power development monitoring and evaluation report
Development and Reform Commissions (Energy Administrations) of provinces (autonomous regions and municipalities), State Grid Corporation, China Southern Power Grid Company, Inner Mongolia Electric Power Company, and other relevant units:
To promote the development and utilization of renewable energy, to scientifically assess the development of renewable energy in different administrative areas, to ensure the realization of the national targets for 15% and 20% non-fossil energy shares in primary energy consumption by 2020 and 2030, respectively, in accordance with the "Guiding opinions on the establishment of a target setting system for the development and utilization of renewable energy (NEA [2016] No. 54)" and the "Circular on administrative tasks for the guaranteed full purchase of electricity from wind and PV power generation NDRC [2016] No. 1150)", the NEA has commissioned the National Renewable Energy Center to collect data on construction and operation of renewable power generation facilities, and in discussion with and after review by the local energy authorities and grid companies in the different administrative areas, has drawn up the "2017 National renewable power development monitoring and evaluation report" (hereinafter referred to as the monitoring and evaluation report)。
Notice is hereby given of the monitoring and evaluation report. Taking this as the basic data for the development and construction of renewable energy projects and grid-connected operation in different administrative areas in 2018, all relevant administrative areas and organizations are asked to attach great importance to the development and the guaranteed full purchase of renewable power, to take effective measures to promote the use of renewable energy, and to actively contribute to the achievement of the national target shares of non-fossil energy consumption。
Annex:2017 National renewable power development monitoring and evaluation report
National Energy Administration
May 11, 2018
Annex
2017 National renewable power development monitoring and evaluation report
1. National renewable power development - overall situation
By the end of 2017, national renewable power generation capacity was 650 GW, accounting for 36.6% of total installed power generation capacity. Of this, 341 GW was hydropower (including pumped storage), 164 GW of wind power, 130 GW of solar PV, and 14.76 GW of biomass power generation capacity。Renewable power generation in 2017 was 1,697.9 TWh, or 26.5% of total electricity generation. Of this, hydropower generation amounted to 1,194.5 TWh, accounting for 18.6% of total electricity generation. Wind power generation amounted to 305.7 TWh, or 4.8% of total power generation, photovoltaic power generation was 118.2 TWh, or 1.8% of the total electricity generation, and biomass power generation was 79.5 TWh, or 1.2% of total power generation。
2. Provincial (autonomous regions, municipalities) renewable electricity consumption
In 2017, total renewable power consumption, including hydropower, was 1,668.6 TWh, an increase of 10.8% year-on-year. Its share in total electricity consumption was 26.5%, an increase of 1.1 percentage points year-on-year。Considering local production, local consumption, and the amount of inter-provincial or inter-regional power exports and imports for each of the provinces (autonomous regions, municipalities), the 2017 share of renewables in total electricity consumption for each of the provinces (autonomous regions, municipalities) were as follows::
Table 1. 2017 Renewable power consumption by province (autonomous region, municipality)
| Province (autonomous region, municipality) | Renewable electricity consumption (GWh) | Renewable electricity consumption (%) | Year-on-year increase, percentage points |
| Beijing | 13,000 | 12.10% | 1.6 |
| Tianjin | 8,900 | 11.00% | 1.7 |
| Hebei | 40,100 | 11.60% | 1.3 |
| Shanxi | 28,000 | 14.10% | 2 |
| Inner Mongolia | 55,400 | 19.20% | 2.8 |
| Liaoning | 26,000 | 12.20% | -0.5 |
| Jilin | 15,600 | 22.20% | 1.5 |
| Heilongjiang | 18,800 | 20.20% | 4.5 |
| Shanghai | 50,900 | 33.30% | 0.7 |
| Jiangsu | 85,600 | 14.70% | 1.9 |
| Zhejiang | 80,900 | 19.30% | -0.6 |
| Anhui | 27,400 | 14.30% | 2 |
| Fujian | 51,100 | 24.20% | -11.6 |
| Jiangxi | 32,800 | 25.40% | -1.8 |
| Shandong | 39,900 | 7.30% | 1.2 |
| Henan | 46,100 | 14.60% | 4.2 |
| Hubei | 80,300 | 43.00% | 4.6 |
| Hunan | 79,800 | 50.40% | 0.7 |
| Guangdong | 193,200 | 32.40% | -1.5 |
| Guangxi | 74,400 | 51.60% | 1.7 |
| Hainan | 4,100 | 13.30% | 1 |
| Chongqing | 48,800 | 49.20% | 0.5 |
| Sichuan | 184,200 | 83.50% | 0.4 |
| Guizhou | 49,300 | 35.60% | -5.6 |
| Yunnan | 131,700 | 85.60% | 4.3 |
| Tibet | 4,900 | 83.80% | -1.1 |
| Shaanxi | 24,000 | 16.00% | 5.9 |
| Gansu | 54,600 | 46.90% | 4 |
| Qinghai | 44,600 | 64.90% | 2.5 |
| Ningxia | 22,500 | 23.00% | 1.9 |
| Xinjiang | 52,100 | 26.00% | 3.1 |
| National | 1,668,600 | 26.50% | 1.1 |
3. Provincial (autonomous regions, municipalities) non-hydro renewable electricity consumption status
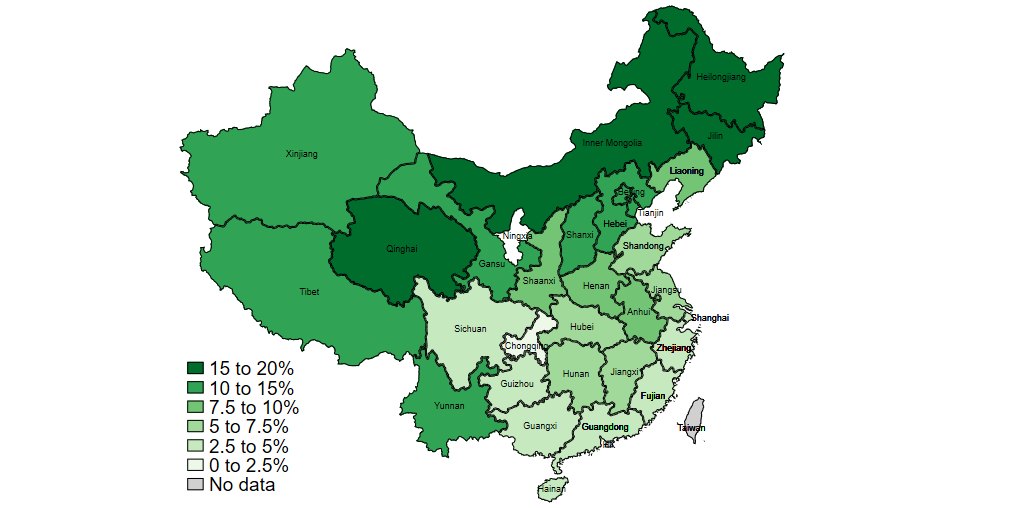
In 2017, total non-hydropower renewable electricity consumption was 502.5 TWh, an increase of 35.2% year-on-year. It accounted for 8.0% of total electricity consumption, an increase of 1.7 percentage points year-on-year。Considering local production, local consumption, and the amount of inter-provincial or inter-regional power exports and imports for each of the provinces (autonomous regions, municipalities), the 2017 share of non-hydropower renewables in total electricity consumption for each of the provinces (autonomous regions, municipalities) are as listed in Table 2。
The share of non-hydro renewable power consumption was the highest in Qinghai, Ningxia, and Inner Mongolia, exceeding 18%;the largest increases in non-hydro renewable power consumption occurred in Tibet, Shaanxi, and Henan provinces (regions), increasing at 3.9, 3.9 and 3.7 percentage points, respectively;regarding the completion of the 2020 non-hydro renewable power consumption target, 17 provinces (autonomous regions, municipalities) including Ningxia, Qinghai and Inner Mongolia have already reached their 2020 target. Hubei, Guizhou, Jiangsu, and Shaanxi have reached 75% or more of their 2020 targets, whilst Guangdong, Hainan and Chongqing are below 50% of their 2020 target。
Table 2. 2017 Non-hydro renewable power consumption by province (autonomous region, municipality)
| Province (autonomous region, municipality) | Non-hydro renewable electricity consumption (GWh) | Non-hydro renewable electricity consumption (%) | Year-on-year increase, percentage points | 2020 Non-hydro renewable electricity share target | Distance to 2020 target |
| Qinghai | 12,700 | 18.50% | 0.2 | 10% | 8.5 |
| Ningxia | 20,600 | 21.00% | 1.9 | 13% | 8 |
| Inner Mongolia | 52,800 | 18.30% | 3 | 13% | 5.3 |
| Yunnan | 21,900 | 14.20% | 1.7 | 10% | 4.2 |
| Jilin | 11,500 | 16.40% | 2.7 | 13% | 3.4 |
| Heilongjiang | 14,600 | 15.80% | 3.4 | 13% | 2.8 |
| Shanxi | 23,800 | 12.00% | 2 | 10% | 2 |
| Anhui | 16,900 | 8.80% | 2.7 | 7% | 1.8 |
| Jiangxi | 8,400 | 6.50% | 2.7 | 5% | 1.5 |
| Henan | 25,500 | 8.10% | 3.7 | 7% | 1.1 |
| Tibet | 800 | 14.00% | 3.9 | 13% | 1 |
| Gansu | 16,000 | 13.80% | 1.3 | 13% | 0.8 |
| Beijing | 11,100 | 10.40% | 1.4 | 10% | 0.4 |
| Tianjin | 8,400 | 10.40% | 1.4 | 10% | 0.4 |
| Hebei | 35,700 | 10.40% | 1.4 | 10% | 0.4 |
| Hunan | 11,500 | 7.20% | 3.1 | 7% | 0.2 |
| Xinjiang | 26,300 | 13.10% | 2 | 13% | 0.1 |
| Hubei | 12,700 | 6.80% | 2.1 | 7% | -0.2 |
| Guizhou | 5,900 | 4.30% | -0.3 | 5% | -0.7 |
| Jiangsu | 31,600 | 5.40% | 1.2 | 7% | -1.6 |
| Sichuan | 7,300 | 3.30% | 1 | 5% | -1.7 |
| Guangxi | 4,400 | 3.00% | 1.7 | 5% | -2 |
| Shanghai | 4,100 | 2.70% | 0.7 | 5% | -2.3 |
| Shaanxi | 11,500 | 7.70% | 3.9 | 10% | -2.3 |
| Fujian | 9,500 | 4.50% | 0.8 | 7% | -2.5 |
| Chongqing | 2,400 | 2.40% | 0.8 | 5% | -2.6 |
| Zhejiang | 17,600 | 4.20% | 0.6 | 7% | -2.8 |
| Shandong | 37,200 | 6.90% | 1.3 | 10% | -3.1 |
| Liaoning | 19,700 | 9.20% | 0.6 | 13% | -3.8 |
| Guangdong | 18,900 | 3.20% | 1.3 | 7% | -3.8 |
| Hainan | 1,400 | 4.70% | 0.2 | 10% | -5.3 |
| National | 502,500 | 8.00% | 1.7 | 9% | -1 |
Note:Power exported from the Guizhou power grid is calculated based on a ratio of 30% of hydropower and 4% of wind power in deliveries, as reported in the “Circular on the Qiandian Plan for electricity deliveries to Guangdong Province in 2017” (YJYX [2017] No. 26). Because the calculation method differs from previous year, the share of non-hydropower renewable power consumption in Guizhou dropped by 0.3% points year-on-year。
[Map added by China Energy Portal]
4. Implementation of the guaranteed purchase of wind and PV electricity generation
In 2016, the National Development and Reform Commission and the National Energy Administration, in accordance with requirements by the "Renewable Energy Law", have approved minimum guaranteed purchases of full-load hours for wind power and PV power generation in key areas, and put forward relevant requirements for their guaranteed full purchase。
In 2017, actual utilization of wind power increased, compared to 2016, in all of the administrative areas that have minimum guaranteed full-load hours purchase requirements. However, Xinjiang (areas with category III resources), Gansu, Ningxia and Jilin (areas with category III resources) did not reach the minimum guaranteed annual purchase of full-load hours of wind power。Among these, the actual utilization (full-load hours) in areas with class II and class III resource areas in Gansu were at 305 hours and 383 hours, respectively, below the minimum guaranteed annual purchase of full-load hours;in Ningxia, due to substandard wind conditions, utilization fell short by 200 full-load hours;Areas with class III resources in Xinjiang and areas with class III resources in Jilin fell short by 116 and 112 full-load hours, respectively。Other areas met the required minimum guaranteed purchase of annual full-load hours of wind power。
In 2017, Inner Mongolia, Qinghai, Heilongjiang, Jilin, Shanxi (areas with class II resources), and Hebei (areas with class II resources) achieved the minimum guaranteed annual purchase of full-load hours of PV power generation. Five provinces (regions) did not meet the requirements. Among them, actual utilization in Gansu (areas with class I and II resources) fell short on the minimum guaranteed purchase by 382 and 271 full-load hours, respectively. Xinjiang (areas with class I and II resources) fell short by 274 and 270 full-load hours, respectively. In Ningxia utilization was 174 full-load hours below requirements, in Shaanxi (areas with class II resources) it was 13 full-load hours below requirements, and in Liaoning it was 5 hours below requirements。
Table 3. 2017 Implementation of the minimum guaranteed purchase of full-load hours for wind power in key administrative areas
| Province (region) | Resource category area | Area | Minimum guaranteed number of full-load hours purchased | 2017 Actual number of full-load hours utilized | 2017 YoY increase in actual number of full-load hours utilized | 2017 full-load hours deficit |
| Inner Mongolia | Class Ⅰ | Areas other than Chifeng, Tongliao, Xing'an League, Hulunbeier | 2000 | 2115 | 177 | +115 |
| Class Ⅱ | Chifeng, Tongliao, Xing'an League, Hulunbeier | 1900 | 1987 | 263 | +87 | |
| Xinjiang | Class Ⅰ | Urumqi, Ili Kazak Autonomous Prefecture, Karamay, Shihezi | 1900 | 2119 | 396 | +219 |
| Class Ⅲ | Areas other than Urumqi, Ili Kazak Autonomous Prefecture, Karamay, Shihezi | 1800 | 1684 | 475 | -116 | |
| Gansu | Class Ⅱ | Jiayuguan, Jiuquan | 1800 | 1495 | 450 | -305 |
| Class Ⅲ | Areas other than Jiayuguan, Jiuquan | 1800 | 1417 | 238 | -383 | |
| Ningxia | Class Ⅲ | Ningxia | 1850 | 1650 | 97 | -200 |
| Heilongjiang | Class Ⅲ | Jixi, Shuangyashan, Qitaihe, Suihua, Yichun, Daxing'anling prefecture | 1900 | 1910 | 207 | +10 |
| Class Ⅳ | Heilongjiang: other areas | 1850 | 1907 | 255 | +57 | |
| Jilin | Class Ⅲ | Baicheng, Songyuan | 1800 | 1688 | 371 | -112 |
| Class Ⅳ | Jilin: other areas | 1800 | 1972 | 518 | +172 | |
| Liaoning | Class Ⅳ | Liaoning | 1850 | 2141 | 213 | +291 |
| Hebei | Class Ⅱ | Zhangjiakou | 1900 | 2185 | 131 | +285 |
| Shanxi | Class Ⅳ | Xinzhou, Shuozhou, Datong | 1900 | 1998 | 72 | +98 |
Table 4. 2017 Implementation of the minimum guaranteed purchase of full-load hours for PV in key administrative areas
| Province (region) | Resource category area | Area | Minimum guaranteed number of full-load hours purchased | 2017 Actual number of full-load hours utilized | 2017 YoY increase in actual number of full-load hours utilized | 2017 full-load hours deficit |
| Inner Mongolia | Class Ⅰ | Areas other than Chifeng, Tongliao, Xing'an League, Hulunbeier | 1500 | 1636 | 160 | +136 |
| Class Ⅱ | Chifeng, Tongliao, Xing'an League, Hulunbeier | 1400 | 1545 | 40 | +145 | |
| Xinjiang | Class Ⅰ | Hami, Tacheng, Altay, Karamay | 1500 | 1226 | 270 | -274 |
| Class Ⅱ | Areas outside of Class Ⅰ areas | 1350 | 1080 | 227 | -270 | |
| Gansu | Class Ⅰ | Jiayuguan, Wuwei, Zhangye, Jiuquan, Dunhuang, Jinchang | 1500 | 1118 | 123 | -382 |
| Class Ⅱ | Areas outside of Class Ⅰ areas | 1400 | 1129 | 88 | -271 | |
| Qinghai | Class Ⅰ | Haixi | 1500 | 1535 | 132 | +35 |
| Class Ⅱ | Areas outside of Class Ⅰ areas | 1450 | 1497 | 44 | +47 | |
| Ningxia | Class Ⅰ | Ningxia | 1500 | 1326 | 57 | -174 |
| Shaanxi | Class Ⅱ | Yulin, Yan'an | 1300 | 1287 | 41 | -13 |
| Heilongjiang | Class Ⅱ | Heilongjiang | 1300 | 1380 | 46 | +80 |
| Jilin | Class Ⅱ | Jilin | 1300 | 1542 | 396 | +242 |
| Liaoning | Class Ⅱ | Liaoning | 1300 | 1295 | 155 | -5 |
| Hebei | Class Ⅱ | Chengde, Zhangjiakou, Tangshan, Qinhuangdao | 1400 | 1438 | 56 | +38 |
| Shanxi | Class Ⅱ | Datong, Shuozhou, Xinzhou | 1400 | 1564 | 4 | +164 |
5. Biomass power generation statistics
By the end of 2017, there were 747 operational biomass power projects in 30 provinces (autonomous regions, municipalities), with a grid-connected installed capacity of 14,762 MW (excluding auto-consumer power plants), and annual generation of 79.45 TWh。Of these, 271 projects were agricultural and forestry residue based biomass power generation projects, with a total grid-connected installed capacity of 7,009 MW and an annual generation of 39.73 TWh;339 projects were MSW incineration based biomass power generation projects, with a total grid-connected installed capacity of 7,253 MW and an annual generation of 37.52 TWh;137 projects were biogas based biomass power generation projects, with a total grid-connected installed capacity of 500 MW, and an annual generation of 2.20 TWh。The top four provinces in terms of grid-connected installed capacity of biomass power were Shandong, Zhejiang, Jiangsu and Anhui, with 2,107 MW, 1,580 MW, 1,459 MW and 1,163 MW, respectively;The top four provinces in terms of annual generation of biomass power were Shandong, Jiangsu, Zhejiang and Anhui, with 10.65 TWh, 9.05 TWh, 8.24 TWh and 6.62 TWh, respectively。The 2017 grid-connected installed capacity and annual generation of various types of biomass power in each of the provinces (autonomous regions and municipalities) were as follows:
Table 5. 2017 Biomass power statistics by province (autonomous region and municipality)
| Province (autonomous region, municipality) | Cumulative grid-connected installed capacity (MW) | Annual power production (GWh) | ||||||
| Total | Agriculture and forestry residue based biomass power generation | MSW incineration based power generation | Biogas based power generation | Total | Agriculture and forestry residue based biomass power generation | MSW incineration based power generation | Biogas based power generation | |
| Beijing | 213 | 0 | 195 | 18 | 1,330 | 0 | 1,220 | 110 |
| Tianjin | 103 | 0 | 103 | 0 | 530 | 0 | 530 | 0 |
| Hebei | 676 | 426 | 241 | 9 | 3,360 | 2,350 | 980 | 30 |
| Shanxi | 390 | 279 | 111 | 0 | 2,280 | 1,720 | 560 | 0 |
| Inner Mongolia | 172 | 102 | 69 | 1 | 770 | 620 | 150 | 0 |
| Liaoning | 158 | 72 | 77 | 9 | 820 | 430 | 330 | 60 |
| Jilin | 534 | 397 | 134 | 3 | 2,800 | 2,270 | 530 | 0 |
| Heilongjiang | 901 | 816 | 81 | 4 | 4,750 | 4,450 | 290 | 10 |
| Shanghai | 272 | 0 | 255 | 17 | 1,870 | 0 | 1,760 | 110 |
| Jiangsu | 1,459 | 494 | 908 | 57 | 9,050 | 3,180 | 5,660 | 210 |
| Zhejiang | 1,580 | 214 | 1,331 | 35 | 8,240 | 1,160 | 6,900 | 180 |
| Anhui | 1,163 | 749 | 400 | 14 | 6,620 | 4,850 | 1,700 | 70 |
| Fujian | 457 | 54 | 391 | 12 | 2,460 | 300 | 2,120 | 40 |
| Jiangxi | 293 | 176 | 81 | 36 | 1,700 | 1,210 | 290 | 200 |
| Shandong | 2,107 | 1,260 | 798 | 49 | 10,650 | 7,030 | 3,450 | 170 |
| Henan | 519 | 391 | 64 | 64 | 2,510 | 2,010 | 310 | 190 |
| Hubei | 732 | 483 | 235 | 14 | 3,690 | 2,370 | 1,290 | 30 |
| Hunan | 551 | 397 | 127 | 27 | 2,670 | 1,990 | 550 | 130 |
| Guangdong | 1,016 | 220 | 728 | 68 | 5,910 | 1,470 | 4,130 | 310 |
| Guangxi | 280 | 170 | 93 | 17 | 1,490 | 860 | 530 | 100 |
| Hainan | 77 | 0 | 77 | 0 | 520 | 0 | 520 | 0 |
| Chongqing | 193 | 60 | 127 | 6 | 1,110 | 200 | 860 | 50 |
| Sichuan | 436 | 55 | 359 | 22 | 2,040 | 350 | 1,610 | 80 |
| Guizhou | 96 | 60 | 36 | 0 | 560 | 370 | 190 | 0 |
| Yunnan | 126 | 0 | 126 | 0 | 600 | 0 | 600 | 0 |
| Shaanxi | 55 | 30 | 14 | 11 | 210 | 130 | 10 | 70 |
| Gansu | 89 | 30 | 58 | 1 | 470 | 170 | 290 | 10 |
| Qinghai | 4 | 0 | 0 | 4 | 20 | 0 | 0 | 20 |
| Ningxia | 84 | 50 | 34 | 0 | 230 | 70 | 160 | 0 |
| Xinjiang | 26 | 24 | 0 | 2 | 190 | 170 | 0 | 20 |
| National | 14,762 | 7,009 | 7,253 | 500 | 79,450 | 39,730 | 37,520 | 2,200 |
In 2017, nationwide biomass power production replaced fossil fuels equivalent to about 25 million tons of standard coal, and reduced carbon dioxide emissions by about 65 million tons。Agriculture and forestry residue based biomass power generation processed about 54 million tons of agricultural and forestry residues;Waste incineration based power generation processed about 106 million tons of MSW, accounting for 37.9% of the national volume of waste generated。
6. Transmission of renewable energy on UHV lines
In 2017, 12 UHV power lines transmitted 300.8 TWh, of which 190.0 TWh renewable power, an increase of 10% year/on/year. It made up 63% of total electricity transport, down 11 percentage points on last year。The 9 UHV lines in the area covered by the State Grid transported 242.6 TWh, of which 131.9 TWh renewable power, accounting for 54% of all electricity transported;the 3 UHV lines in areas covered by the China Southern Grid carried 58.1 TWh, all of which was renewable electricity。
Table 6. 2017 UHV power line transmission statistics
| No. | Transmission line name | Annual transmission | Renewable electricity (GWh) | Share of renewable electricity | Year-on-year increase, percentage points |
| (GWh) | |||||
| 1 | Changnan line | 6,550 | 3,700 | 56% | 21 |
| 2 | Ximeng - Shandong | 6,480 | 0% | ||
| 3 | Anhui to East line | 59,450 | 0% | ||
| 4 | Zhejiang Fujian line | 4,020 | 0% | ||
| 5 | Fulong - Fengxian DC | 32,400 | 32,030 | 99% | -1 |
| 6 | Ximeng - Jiangsu DC | 38,710 | 38,460 | 99% | |
| 7 | Binjin DC | 38,960 | 38,960 | 100% | |
| 8 | Tianzhong DC | 35,970 | 15,260 | 42% | 19 |
| 9 | Lingshao DC | 20,130 | 3,440 | 17% | -12 |
| 10 | Chusui DC | 28,220 | 28,220 | 100% | |
| 11 | Puqiao DC | 29,750 | 29,750 | 100% | |
| 12 | Xindong DC | 140 | 140 | 100% | |
| National | 300,750 | 189,960 | 63% | -11 | |
Note:Data on projects 1-9 as reported by the State Grid Corporation, data on projects 10-12 as reported by the Southern Grid Corporation。The Xindong DC line was put into operation in December 2017。
7. Implementation status of the national clean energy demonstration provinces (regions)
Zhejiang。In 2017, total renewable electricity consumption was 80.9 TWh, accounting for 19.3% of the province's total electricity consumption;non-hydro renewable electricity consumption was 17.6 TWh, accounting for 4.2% of the province's total electricity consumption, up 0.6 percentage points on last year。
Sichuan。In 2017, total renewable electricity consumption was 184.2 TWh, accounting for 83.5% of the province's total electricity consumption;non-hydro renewable electricity consumption was 7.3 TWh, accounting for 3.3% of the province's total electricity consumption, up 1.0 percentage points on last year。
Ningxia。In 2017, total renewable electricity consumption increased substantially, reaching 22.5 TWh, accounting for 23.0% of the province's total electricity consumption, up 1.9 percentage points on last year;non-hydro renewable electricity consumption was 20.6 TWh, accounting for 21.0% of the province's total electricity consumption, up 1.9 percentage points on last year。Utilization of wind and photovoltaic power generation did not reach the minimum guaranteed amount of full-load hours purchased, falling short by 200 hours and 174 hours。
Gansu。In 2017, total renewable electricity consumption increased substantially, reaching 54.6 TWh, accounting for 46.1% of the province's total electricity consumption, up 3.2 percentage points on last year;non-hydro renewable electricity consumption was 16.0 TWh, accounting for 13.8% of the province's total electricity consumption, up 1.3 percentage points on last year。Utilization of wind and photovoltaic power generation was relatively far from reaching the minimum guaranteed amount of full-load hours purchased. Utilization of wind power in areas with resources Class II and Class III fell short by 305 and 383 full-load hours, respectively;Utilization of PV in areas with resources Class I and Class II fell short by 382 and 271 full-load hours, respectively。
Qinghai。In 2017, total renewable electricity consumption was 44.6 TWh, accounting for 64.9% of the province's total electricity consumption, up 2.5 percentage points on last year;non-hydro renewable electricity consumption was 12.7 TWh, accounting for 18.5% of the province's total electricity consumption, up 0.2 percentage points on last year。
Annex:Renewable power development monitoring indicators and calculation method
Annex
Renewable power development monitoring indicators and calculation method
1. The provincial (regional, city-level) renewable electricity consumption includes the local renewable power generation, with inter-provincial imports of renewable electricity added, and inter-provincial exports of renewable electricity subtracted。
Renewable electricity consumption within the province (autonomous region, municipality) = local renewable electricity generation - inter-provincial exports of renewable electricity + inter-provincial imports of renewable electricity
2. The provincial (regional, directly-controlled municipality-level) share of renewable electricity is equal to the provincial (regional, city-level) renewable electricity consumption divided by total electricity consumption in the respective locality。
3. The provincial (regional, directly-controlled municipality-level) total electricity consumption and renewable electricity production, will be determined on the basis of statistics on the power industry published by the National Bureau of Statistics and information mechanisms recognized by the national government 。
4. Inter-provincial and inter-regional volumes of renewable electricity traded, will be determined on the basis of data provided by the State Grid Corporation, China Southern Power Grid Company and the Inner Mongolia Electric Power Company, considering transmission losses per transmission line。
5. In inter-provincial or inter-regional renewable power trading, there are two possible cases; "province to province", and "province to region"。In the case of "province to region", for example when East or Central China accepts renewable electricity input from provinces outside of the region, the import of renewable electricity into each province within the region will be calculated using the proportion of total electricity consumption of each province as a share of the regional grids total electricity consumption。That is:

![\[\small Imported\,electricity\,into\,province\,(autonomous\,region,\,city) _{i}\,=\]](https://chinaenergyportal.org/wp-content/ql-cache/quicklatex.com-a05e40157413fbeafbb0db3a24d30b24_l3.png "Rendered by QuickLaTeX.com")
![\[\,\\ \small imported\,renewable\,electricity\times\left(\frac{total\,electricity\,consumption\,in\,province\,(autonomous\,region,\,city) _{i}}{\sum_{i=1}^n total\,electricity\,consumption\,in\,province\,(autonomous\,region,\,city)_{i}}\right)\]](https://chinaenergyportal.org/wp-content/ql-cache/quicklatex.com-74410f02a8e57689026af24b33637b4d_l3.png "Rendered by QuickLaTeX.com")
where n denotes all provinces (autonomous region, city) within the regional grid
6. The Jing-Jin-Ji power grid (Beijing, Tianjin, North Hebei, South Hebei grid) is a special area. For the purposes of calculating the share of non-hydro renewable electricity in total electricity consumption, non-hydro renewable electricity from centralized projects and from inter-provincial imports are shared uniformly, whilst non-hydro renewable electricity generation from distributed projects within each area is counted towards the respective area。


