
All translations on this site are unofficial and provided for reference purpose only.
To view translations, select English under Step 1 (at the right of the screen). Not every item is (fully) translated. If you’re still seeing Chinese, you can use machine translation, under Step 2, to make sense of the rest.
Want to help translate? Switch to English under Step 1, and check ‘edit translation’ (more explanation in the FAQ). Even if you translate just a few lines, this is still very much appreciated! Remember to log in if you would like to be credited for your effort. If you’re unsure where to start translating, please see the list of Most wanted translations.
2018 Q3 PV installations utility and distributed by province
Original title: 2018年前三季度风电并网运行情况
Links: Source document (in Chinese) (link).
In the first three quarters of 2018, China's newly installed capacity of PV was 34.54 GW, down 19.7% on the same period last year. Of this, 17.4 GW was utility scale PV power plants, down 37.2% on the same period last year;newly installed capacity of distributed PV was 17.14 GW, an increase of 12% on the same period last year.。
By the end of September, total nationwide PV power generation capacity reached 164.74 GW, of which 117.94 GW of utility-scale PV power plants, and 46.80 GW distributed PV。PV power generation in the first three quarters was 133.83 TWh, an increase of 56.2% on the same period last year;the curtailment rate of PV was 2.9%, down 2.7 percentage points on the same period last year。The curtailment occurred mainly in Xinjiang and Gansu, with 1.73 TWh curtailed in Xinjiang (excluding XPCC), at a curtailment rate of 16%, down 5.4 percentage points on the same period last year;a further 780 GWh of PV was curtailed in Gansu, at a curtailment rate of 10%, down 11 percentage points on the same period last year。
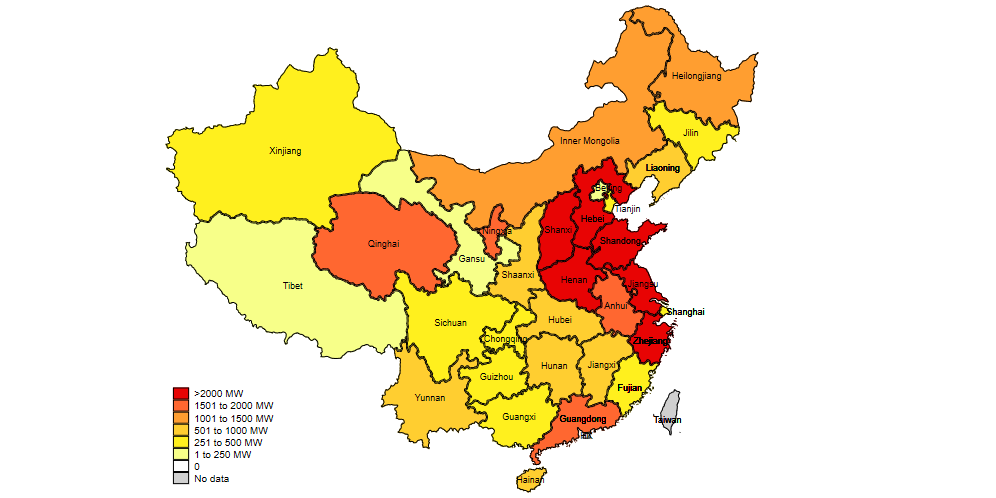
In terms of regional installations, newly added capacity in North China was 8,424 MW, down 17.9 percent on the same period last year, accounting for 24.4% of national newly installed capacity;Northeast China added 2,873 MW, down 10.4 percent on the same period last year, accounting for 8.3% of national newly installed capacity;East China added 8,582 MW, down 28.2 percent on the same period last year, accounting for 24.8% of national newly installed capacity;Central China added 5,872 MW, down 35.5 percent on the same period last year, accounting for 17% of national newly installed capacity;Northwest China added 4,789 MW, down 16.2 percent on the same period last year, accounting for 13.9% of national newly installed capacity;South China added 4,011 MW, up 44.2 percent on the same period last year, accounting for 11.6% of national newly installed capacity。Distributed PV continued maintain rapid growth over the first three quarters of 2018, with circa 2,000 MW of newly added capacity in each of the provinces of Shandong, Zhejiang, Henan and Jiangsu. The newly added capacity of distributed PV in these four provinces accounted for 49.1% of newly added capacity nationwide。
For detailed statistics on national PV installation statistics by province (autonomous region, municipality), see the Annex。
[map added by China Energy Portal]
Annex:
2018 Q3 National PV statistics
| Province (autonomous region, municipality) | Cumulative installed capacity (MW) | Newly installed capacity (MW) | ||
| Of which:utility scale PV plants | Of which:utility scale PV plants | |||
| Total | 164,740 | 117,940 | 34,540 | 17,400 |
| Beijing | 360 | 50 | 110 | 0 |
| Tianjin | 1,050 | 790 | 380 | 260 |
| Hebei | 11,270 | 7,920 | 2,590 | 1,310 |
| Shanxi | 8,040 | 6,480 | 2,140 | 1,180 |
| Inner Mongolia | 8,800 | 8,700 | 1,370 | 1,290 |
| Liaoning | 2,900 | 2,140 | 670 | 300 |
| Jilin | 2,010 | 1,410 | 420 | 330 |
| Heilongjiang | 1,950 | 1,370 | 1,010 | 660 |
| Shanghai | 850 | 60 | 270 | 40 |
| Jiangsu | 12,370 | 7,180 | 3,290 | 1,340 |
| Zhejiang | 10,890 | 3,610 | 2,750 | 460 |
| Anhui | 10,690 | 6,540 | 1,810 | 880 |
| Fujian | 1,380 | 360 | 460 | 20 |
| Jiangxi | 5,260 | 2,900 | 760 | 130 |
| Shandong | 13,140 | 6,280 | 2,620 | 480 |
| Henan | 9,620 | 5,850 | 2,590 | 550 |
| Hubei | 5,040 | 3,310 | 900 | 280 |
| Hunan | 2,710 | 1,170 | 950 | 320 |
| Guangdong | 4,940 | 2,630 | 1,620 | 700 |
| Guangxi | 1,090 | 860 | 400 | 230 |
| Hainan | 1,000 | 870 | 670 | 600 |
| Chongqing | 420 | 390 | 300 | 280 |
| Sichuan | 1,720 | 1,610 | 370 | 350 |
| Guizhou | 1,810 | 1,720 | 440 | 370 |
| Yunnan | 3,200 | 3,080 | 870 | 800 |
| Tibet | 890 | 890 | 100 | 100 |
| Shaanxi | 6,170 | 5,440 | 930 | 680 |
| Gansu | 8,040 | 7,770 | 190 | 110 |
| Qinghai | 9,550 | 9,460 | 1,650 | 1,610 |
| Ningxia | 7,860 | 7,370 | 1,660 | 1,490 |
| Xinjiang | 9,350 | 9,340 | 270 | 260 |
| XPCC | 390 | 390 | 0 | 0 |
Note:1.The above statistics do not include Hong Kong, Macao and Taiwan;
2.Data source:National Renewable Energy Center。


