
All translations on this site are unofficial and provided for reference purpose only.
To view translations, select English under Step 1 (at the right of the screen). Not every item is (fully) translated. If you’re still seeing Chinese, you can use machine translation, under Step 2, to make sense of the rest.
Want to help translate? Switch to English under Step 1, and check ‘edit translation’ (more explanation in the FAQ). Even if you translate just a few lines, this is still very much appreciated! Remember to log in if you would like to be credited for your effort. If you’re unsure where to start translating, please see the list of Most wanted translations.
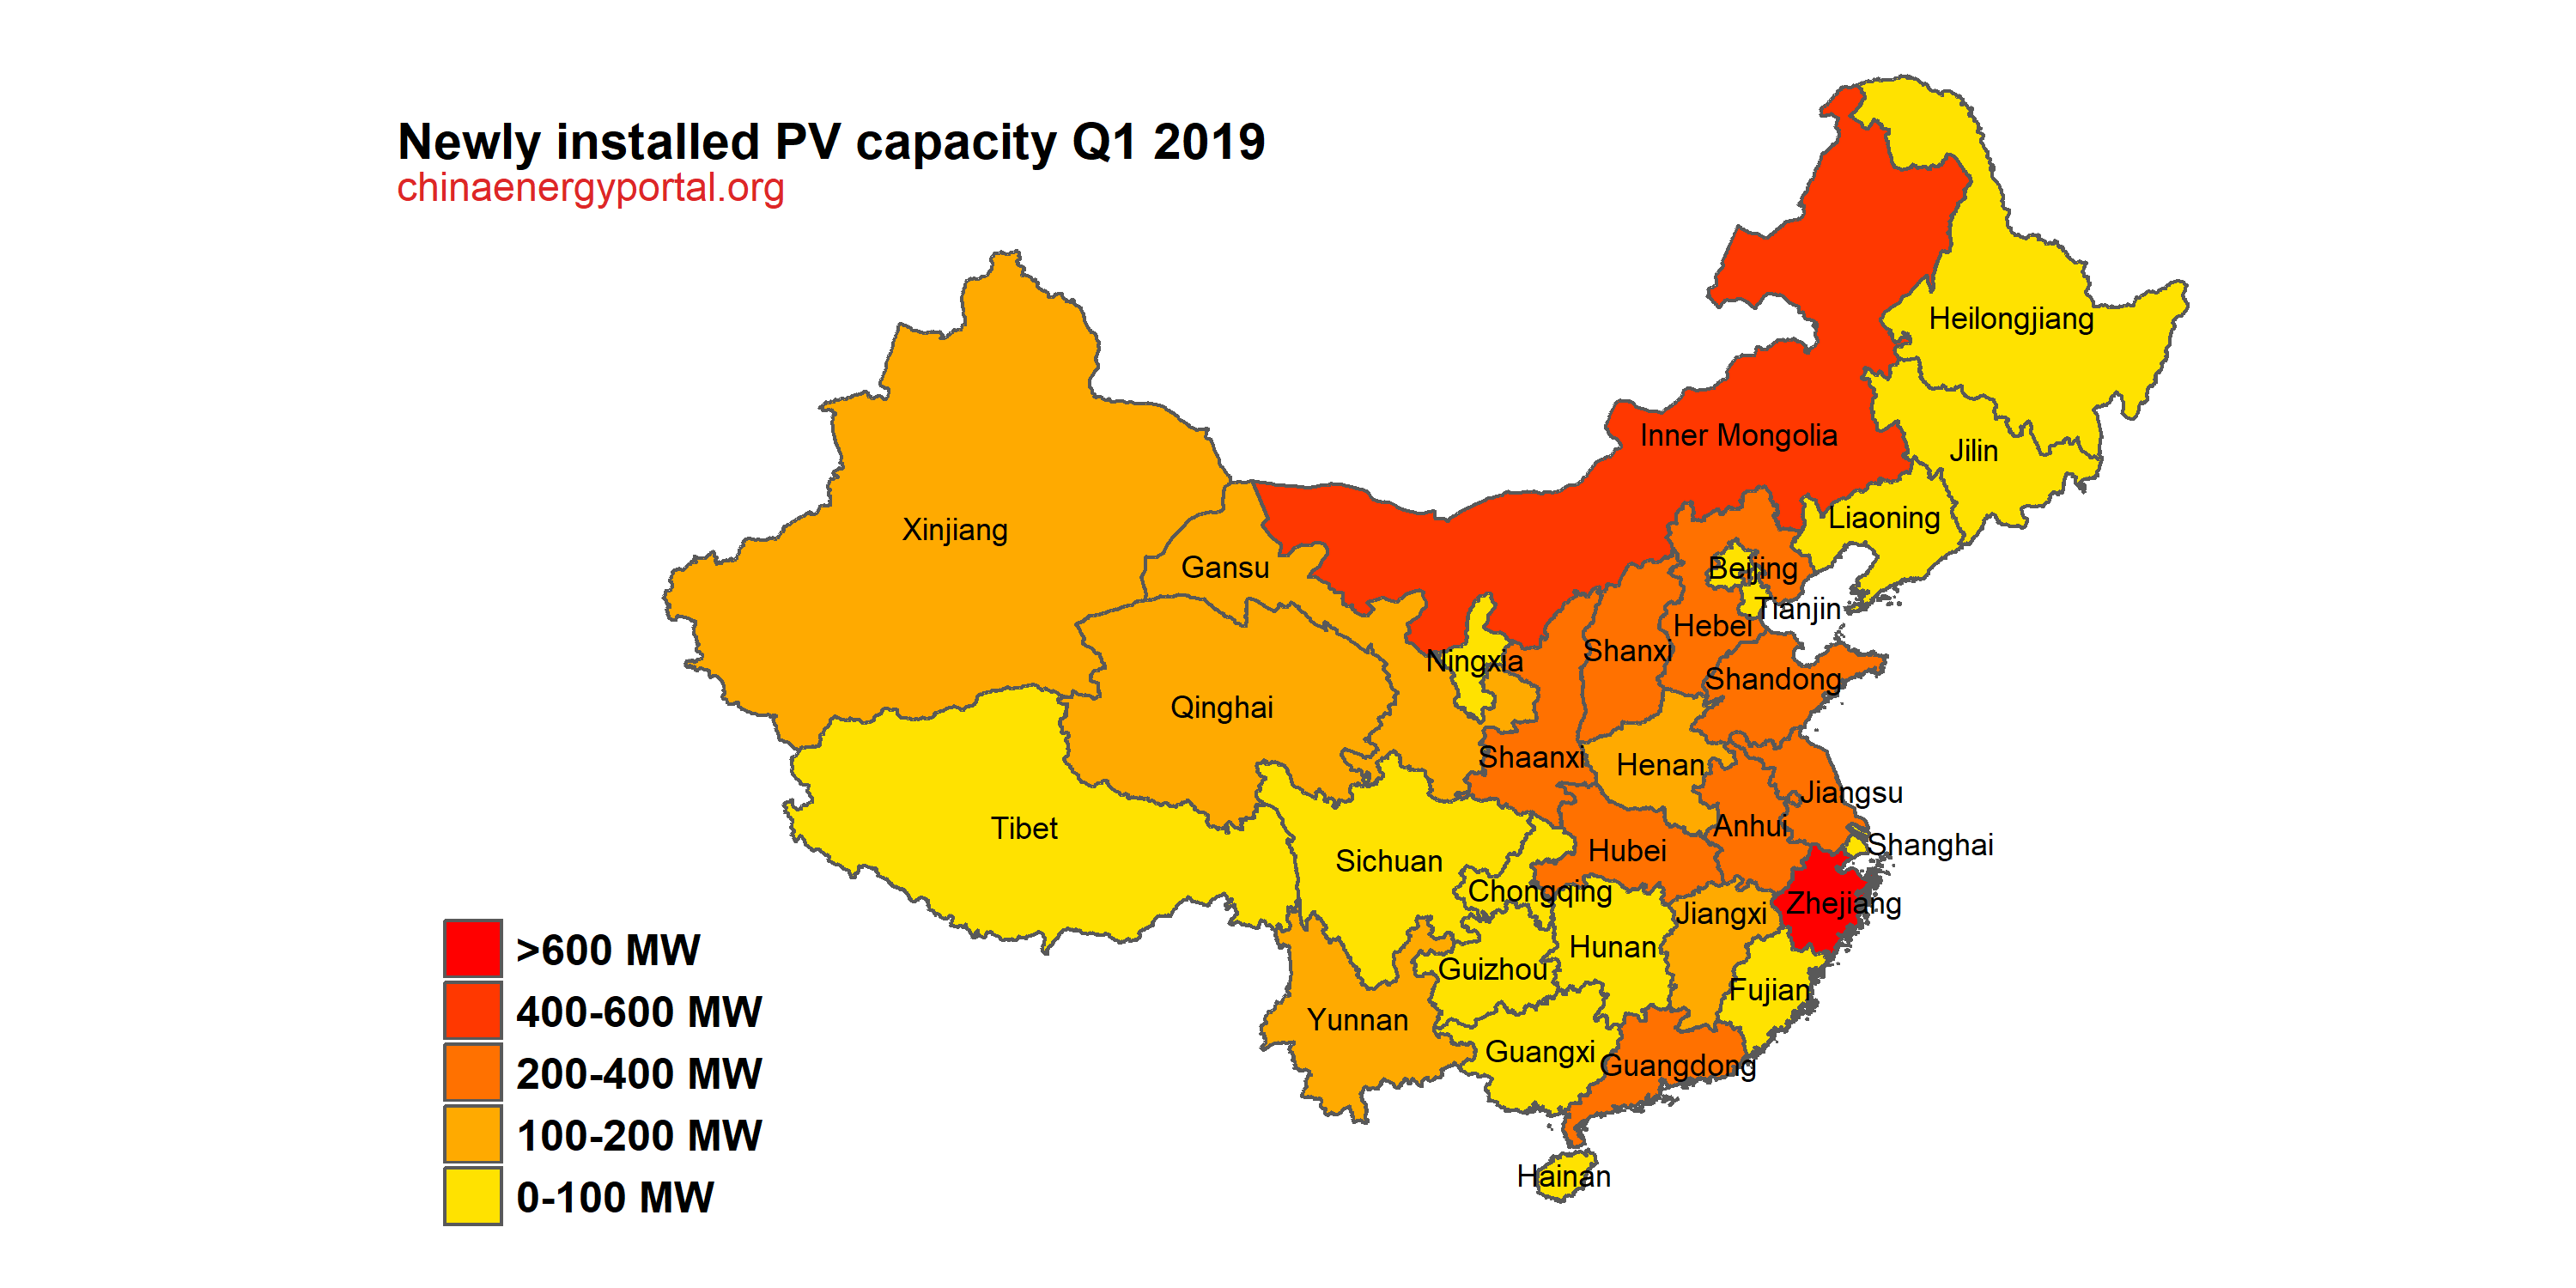
2019 Q1 PV installations utility and distributed by province
Original title: 2019年一季度光伏发电建设运行情况
Links: Source document (in Chinese) (link).
By the end of March 2019, nationwide installed capacity of PV reached 179.7 GW, an increase of 28% year-on-year, with new installations of 5.2 GW。Of this, installed capacity of utility-scale power plants reached 126.25 GW, an increase of 23% year-on-year, with new installations of 2.4 GW;installed capacity of distributed PV reached 53.41 GW, an increase of 23% year-on-year, with new installations of 2.8 GW。
In Q1 of 2019, PV power generation was 44 TWh, an increase of 26% on the same period last year;PV curtailment was 1.24 TWh, down 380 MWh on the same period last year;the curtailment rate was 2.7%, down 1.7 percentage points on the same period last year, achieving a 'double reduction' of total curtailment and curtailment rate。Curtailment of PV was mainly concentrated in Xinjiang and Gansu, with 350 MWh curtailed in Xinjiang (excluding XPCC), or a curtailment rate of 12%, down 9.4 percentage points on the same period last year;210 MWh was curtailed in Gansu, or a curtailment rate of 7.2%, down 2.9 percentage points on the same period last year。
Looking at the distribution of new installations, 1.457 GW was installed in Northern China, accounting for 28% of nationwide installations;82 MW was installed in North-East China, accounting for 1.6% of nationwide installations;1.476 GW was installed in East China, accounting for 28.4% of nationwide installations;798 MW was installed in Central China, accounting for 15.3% of nationwide installations;825 MW was installed in North-West China, accounting for 15.9% of nationwide installations;559 MW was installed in South China, accounting for 10.8% of nationwide installations。
For statistics on construction of PV generation capacity by province (autonomous region, municipality) in Q1 2019 please see the Annex。
Annex
2019 Q1 statistics on construction and operation of PV power generation
| Province (autonomous region, municipality) | Cumulative installed capacity (MW) | Newly installed capacity (MW) | ||
| Of which:utility scale PV plants | Of which:utility scale PV plants | |||
| Total | 179,660 | 126,250 | 5,200 | 2,400 |
| Beijing | 420 | 50 | 25 | 0 |
| Tianjin | 1,320 | 970 | 40 | 0 |
| Hebei | 12,710 | 8,690 | 370 | 130 |
| Shanxi | 8,900 | 7,020 | 260 | 210 |
| Inner Mongolia | 9,880 | 9,550 | 430 | 420 |
| Liaoning | 3,050 | 2,200 | 30 | 10 |
| Jilin | 2,680 | 2,030 | 30 | 0 |
| Heilongjiang | 2,160 | 1,410 | 15 | 0 |
| Shanghai | 970 | 60 | 90 | 4 |
| Jiangsu | 13,690 | 7,950 | 360 | 30 |
| Zhejiang | 12,110 | 3,900 | 730 | 280 |
| Anhui | 11,380 | 6,890 | 200 | 120 |
| Fujian | 1,570 | 400 | 90 | 30 |
| Jiangxi | 5,550 | 3,000 | 190 | 60 |
| Shandong | 13,960 | 6,540 | 350 | 60 |
| Henan | 10,040 | 6,000 | 130 | 0 |
| Hubei | 5,480 | 3,520 | 380 | 170 |
| Hunan | 3,010 | 1,310 | 90 | 50 |
| Guangdong | 5,520 | 2,820 | 240 | 3 |
| Guangxi | 1,300 | 1000 | 60 | 60 |
| Hainan | 1,360 | 1,230 | 1 | 1 |
| Chongqing | 420 | 390 | 3 | 0 |
| Sichuan | 1,810 | 1,670 | 7 | 0 |
| Guizhou | 1,860 | 1,680 | 80 | 0 |
| Yunnan | 3,600 | 3,440 | 170 | 130 |
| Tibet | 1020 | 1020 | 40 | 40 |
| Shaanxi | 7,390 | 6,240 | 230 | 100 |
| Gansu | 8,470 | 7,980 | 190 | 190 |
| Qinghai | 9,720 | 9,620 | 160 | 150 |
| Ningxia | 8,250 | 7,660 | 90 | 50 |
| Xinjiang | 9,660 | 9,620 | 120 | 100 |
| XPCC | 390 | 390 | 0 | 0 |
Note:1. The above statistics do not include Hong Kong, Macao and Taiwan;2. Data source:National Renewable Energy Center。


