
All translations on this site are unofficial and provided for reference purpose only.
To view translations, select English under Step 1 (at the right of the screen). Not every item is (fully) translated. If you’re still seeing Chinese, you can use machine translation, under Step 2, to make sense of the rest.
Want to help translate? Switch to English under Step 1, and check ‘edit translation’ (more explanation in the FAQ). Even if you translate just a few lines, this is still very much appreciated! Remember to log in if you would like to be credited for your effort. If you’re unsure where to start translating, please see the list of Most wanted translations.
2020 Q1 PV installations utility and distributed by province
Original title: 2020年一季度光伏发电并网运行情况
Links: Source document (in Chinese) (link).
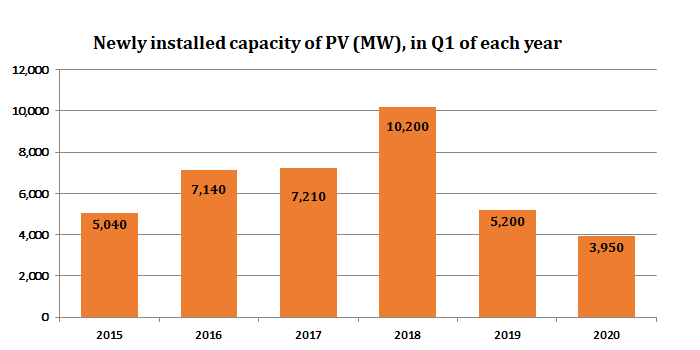
According to industry statistics, in the first quarter of 2020, nationwide newly installed PV capacity was 3.95 GW, including 2.23 GW utility-scale installations and 1.72 GW distributed installations。As of the end of March, nationwide cumulative installed PV capacity reached 208 GW, of which 144 GW utility-scale installations and 64.35 GW distributed installations。Considering newly installed capacity, there were relatively large additions in North China and South China, with 1210 MW and 990 MW, respectively。
PV power generation in the first quarter was 52.8 TWh, a year-on-year increase of 19.9%;Nationwide average PV productivity was 248 full-load hours, an increase of 8 hours year-on-year。PV productivity was the highest in Northeast China, at 350 full-load hours, down 9 hours year-on-year;PV productivity was the lowest in East China, at 190 full-load hours, a year-on-year increase of 22 hours。
2020 Q1 statistics on grid-connected PV power generation
| Province (autonomous region, municipality) | Cumulative installed capacity (MW) | Newly installed capacity (MW) | ||
| Of which:utility scale PV plants | Of which:utility scale PV plants | |||
| Total | 208,250 | 143,900 | 3,950 | 2,230 |
| Beijing | 590 | 50 | 80 | 0 |
| Tianjin | 1,480 | 1,080 | 50 | 40 |
| Hebei | 14,950 | 9,780 | 200 | 170 |
| Shanxi* | 11,170 | 8,960 | 290 | 390 |
| Inner Mongolia | 11,280 | 10,440 | 470 | 440 |
| Liaoning | 3,470 | 2,470 | 30 | 10 |
| Jilin | 2,740 | 2,050 | 0 | 0 |
| Heilongjiang | 2,750 | 1,950 | 10 | 0 |
| Shanghai | 1,140 | 60 | 60 | 0 |
| Jiangsu | 15,130 | 8,210 | 270 | 0 |
| Zhejiang | 13,750 | 4,180 | 360 | 40 |
| Anhui | 12,570 | 7,730 | 30 | 0 |
| Fujian | 1,730 | 380 | 40 | 0 |
| Jiangxi | 6,440 | 3,690 | 140 | 20 |
| Shandong | 16,470 | 6,790 | 280 | 20 |
| Henan | 10,710 | 6,000 | 170 | 0 |
| Hubei | 6,380 | 4,300 | 170 | 110 |
| Hunan | 3,470 | 1,580 | 30 | 30 |
| Guangdong | 6,700 | 3,520 | 600 | 500 |
| Guangxi | 1,580 | 1,270 | 230 | 210 |
| Hainan | 1,400 | 1,270 | 0 | 0 |
| Chongqing | 650 | 580 | 0 | 0 |
| Sichuan | 1,890 | 1,690 | 10 | 0 |
| Guizhou | 5,140 | 4,950 | 40 | 40 |
| Yunnan | 3,870 | 3,520 | 120 | 20 |
| Tibet | 1,280 | 1,280 | 180 | 180 |
| Shaanxi | 9,460 | 7,810 | 70 | 30 |
| Gansu | 9,090 | 8,360 | 10 | 0 |
| Qinghai | 11,010 | 10,860 | 0 | 0 |
| Ningxia | 9,180 | 8,440 | 0 | 0 |
| Xinjiang | 10,420 | 10,270 | 10 | 0 |
| XPCC | 390 | 390 | 0 | 0 |
Note:1. * Shanxi's newly added distributed PV was negative 100 MW in the first quarter;
2. The above statistics do not include Hong Kong, Macao and Taiwan;
3. Data source:National Renewable Energy Center。


