
All translations on this site are unofficial and provided for reference purpose only.
To view translations, select English under Step 1 (at the right of the screen). Not every item is (fully) translated. If you’re still seeing Chinese, you can use machine translation, under Step 2, to make sense of the rest.
Want to help translate? Switch to English under Step 1, and check ‘edit translation’ (more explanation in the FAQ). Even if you translate just a few lines, this is still very much appreciated! Remember to log in if you would like to be credited for your effort. If you’re unsure where to start translating, please see the list of Most wanted translations.
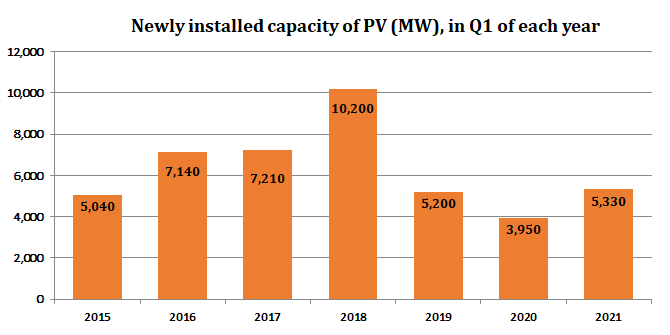
2021 Q1 PV installations utility and distributed by province
Original title: 2021年一季度全国光伏发电建设运行情况
Links: Source document (in Chinese) (link).
| Province (autonomous region, municipality) | Cumulative installed capacity (MW) | Newly installed capacity (MW) | ||
| Of which:utility scale PV plants | Of which:utility scale PV plants | |||
| Total | 258500 | 177360 | 5330 | 2520 |
| Beijing | 620 | 50 | 10 | |
| Tianjin | 1670 | 1200 | 30 | 10 |
| Hebei | 22180 | 14560 | 290 | 130 |
| Shanxi | 13110 | 10270 | 30 | 10 |
| Inner Mongolia | 12600 | 11690 | 220 | 290 |
| Liaoning | 4040 | 2820 | 40 | |
| Jilin | 3380 | 2620 | ||
| Heilongjiang | 3390 | 2550 | 210 | 200 |
| Shanghai | 1430 | 200 | 60 | |
| Jiangsu | 17230 | 9100 | 400 | 140 |
| Zhejiang | 15540 | 4500 | 370 | |
| Anhui | 14210 | 8440 | 470 | 150 |
| Fujian | 2110 | 390 | 90 | 10 |
| Jiangxi | 7850 | 4780 | 90 | 10 |
| Shandong | 23800 | 8540 | 1050 | 440 |
| Henan | 11990 | 6060 | 250 | 20 |
| Hubei | 7070 | 4910 | 100 | 60 |
| Hunan | 3970 | 1920 | 60 | 20 |
| Guangdong | 8400 | 4150 | 430 | 30 |
| Guangxi | 2270 | 1830 | 200 | 190 |
| Hainan | 1430 | 1270 | 30 | |
| Chongqing | 680 | 600 | 10 | |
| Sichuan | 1910 | 1690 | ||
| Guizhou | 10570 | 10380 | ||
| Yunnan | 3890 | 3500 | ||
| Tibet | 1370 | 1370 | ||
| Shaanxi | 11350 | 9410 | 490 | 460 |
| Gansu | 9770 | 9020 | 120 | 110 |
| Qinghai | 15810 | 15650 | ||
| Ningxia | 12250 | 11460 | 280 | 250 |
| Xinjiang | 12220 | 12060 | ||
| XPCC | 390 | 390 | ||
Note:1. The above statistics do not include Hong Kong, Macao and Taiwan;
2.数据来源:National Renewable Energy Center。


