
All translations on this site are unofficial and provided for reference purpose only.
To view translations, select English under Step 1 (at the right of the screen). Not every item is (fully) translated. If you’re still seeing Chinese, you can use machine translation, under Step 2, to make sense of the rest.
Want to help translate? Switch to English under Step 1, and check ‘edit translation’ (more explanation in the FAQ). Even if you translate just a few lines, this is still very much appreciated! Remember to log in if you would like to be credited for your effort. If you’re unsure where to start translating, please see the list of Most wanted translations.
Establishment of market environment monitoring and evaluation system to guide the healthy and orderly development of the PV industry
Original title: 国家能源局关于建立市场环境监测评价机制引导光伏产业健康有序发展的通知
Links: Source document (in Chinese) (link).
NEA New Energy [2017] No. 79
National Energy Administration
Circular on the establishment of a market environment monitoring and evaluation system to guide the healthy and orderly development of the PV industry
To Development and Reform Commissions (Energy Administrations) of all provinces (autonomous regions, municipalities) and Xinjiang Production and Construction Corps, branches agencies for energy supervision, State Grid Corporation, China Southern Power Grid Company, Inner Mongolia Power Company, Huaneng, Datang, Huadian, China Energy Investment Corporation, State Power Investment , Three Gorges, China Nuclear, China Guangdong Nuclear Power, CECEP, Hydropower Planning Design General Institute, photovoltaic industry associations and research institutes, National Renewable Energy Center
In order to fully implement the spirit of the 19th CPC National Congress and under the guidance of Xi Jinping thought on socialism with Chinese characteristics for a new era, to implement the "State Council's Opinions on Promoting the Healthy Development of the Photovoltaic Industry" (GuoFa [2013] No. 24), to promote the continuous improvement of the environment for construction and operation of photovoltaic power generation, to guide rational investment by industry, and to promote the healthy and orderly development of the photovoltaic industry, the NEA has studied the establishment of a monitoring and evaluation system of the market environment for PV power generation。Notice is hereby given of the following:
1. Tasks for comprehensively carrying out monitoring and evaluation。The National Energy Administration will carry out monitoring and evaluation of the market environment for photovoltaic power generation by provincial-level administrative region。For provincial-level administrative areas with multiple benchmark feed-in tariff areas for photovoltaic power generation, evaluation shall be separated according to different resource areas。Monitoring and evaluation shall occur through analysis of a combination of the province's statistical data, and a survey of a sample of photovoltaic power generation enterprises。Monitoring and evaluation shall regard ordinary photovoltaic power plants and 'PV leader' base projects, and not include village-level PV power plants for poverty alleviation or distributed photovoltaic systems。
2. Establishment of a science-based monitoring and evaluation system。The evaluation system comprehensively considers the market environment for development and investment and operation risks in each administrative region, and is composed of two types of evaluation indexes for competitiveness and risk, with overall evaluation utilizing a combination of binding indicators and judgment to determine an evaluation result。Evaluation results are divided into three levels of green, orange and red. A green result indicates the market environment is relatively good, a orange result indicates the market environment is normal, and a red result indicates the market environment is relatively poor。
The competitiveness evaluation index includes six items, for land conditions, local government services, grid enterprise services, the level of national electricity subsidies, the average reduction in subsidy for projects with feed-in tariff determined in competitive allocation, and the level of local government subsidies。The risk evaluation index includes three items, for the level of PV curtailment, market consumption risk, and the level of implementation of the guaranteed full purchase policy。See also Appendix 1。
3. Regular publication of monitoring and evaluation results。The National Renewable Energy Information Management Center is responsible for practical work on the PV market environment monitoring and evaluation, and shall publish dynamic monitoring data according to quarterly statistics;the National Energy Administration shall publish monitoring and evaluation results in the first quarter of each year。Provincial-level energy authorities should urge the relevant photovoltaic power generation enterprises to submit data required for the monitoring and evaluation through the national renewable energy power generation project information management system, in a timely manner, on a quarterly basis。For the 2016 PV power generation market environment monitor and evaluation result for different administrative areas, see Appendix 2。
4. Realize the full potential of the guiding role of the evaluation。The monitoring and evaluation results are an important basis on which the national government adjusts and perfects the policies for the PV industry and the guidance for the orderly development of solar energy resources, and on the basis of evaluation results differentiated guidance and differentiated administrative management is implemented。For administrative areas where a red evaluation result is issued, the National Energy Administration will, in principle, not allocate an annual quota for new construction for the year in which the evaluation result is published (except for renewable energy bases for which the national government has already specified construction of UHVDC transmission lines for inter-provincial export of electricity);except for photovoltaic power generation projects that have both been included in the construction quota of previous years and have already started construction, grid enterprises are advised to suspend accepting applications for grid connection of projects, and industry is advised to invest with cautioun。For administrative areas where a green evaluation result is issued, the National Energy Administration will maintain the quota for PV power plant development in accordance with earlier planning documents and further provide appropriate levels of support; local governments and industry may arrange investment and construction in an orderly manner。For administrative areas where a orange evaluation result is issued, the National Energy Administration may allocate a guiding development quota of up to 50% of existing annual plans, under the precondition that energy authorities of the provincial-level government issue effective measures to protect and improve the market environment。
Annex:
1. Methods and standards for the monitoring and evaluation of the market environment of PV power generation (Trial)
2. 2016 PV power generation market environment monitor and evaluation result for different administrative areas (Trial)
National Energy Administration
December 8, 2017
Annex 1
Methods and standards for the monitoring and evaluation of the market environment of PV power generation (Trial)
1. Evaluation method
The monitoring and evaluation of the market environment of PV power generation utilizes a combination of binding indicators and judgment to determine an evaluation result。The overall evaluation result is the total sum of various indexes for competitiveness and risk, with equal weight given to the two different types of indexes。A total score of less than 60 points gives a red evaluation result;a total score of 60 points or more, but less than 80 points gives an orange evaluation result;a total score of 80 points or more gives a green evaluation result。The extent of curtailment is a binding index, with a curtailment rate of more than 10% directly leading to a red evaluation result。
2. The evaluation criteria
| Item | Content | Score | Evaluation criteria |
| 1. Competitiveness evaluation index | 1.1 Land conditions | 15 | The overall score is based on two items, divided into an assessment on the basis of annual statistics on the land use cost for newly-built photovoltaic power stations (converted to annual land use cost on the basis of costs for greenfield sites, excluding urban land use tax or farmland use tax) and land taxation (including urban land use tax or farmland use tax): 1. Land use cost of 300 RMB or less per mu and year, 15 points;Land use cost of 300 RMB or more per mu and year, but below 1000 RMB per mu and year, deduct 1 point for every 100 RMB per mu and year;Land use cost of 1000 RMB per mu and year or more, deduct 2 points for every 100 RMB per mu and year。 2. For the share of land on which farmland use tax is levied, as a share of total land used, for every increment of 10% or more, deduct 5 points;For the share of land on which urban land use tax is levied, as a share of total land used, for every increment of 5% or more, deduct 5 points。 The minimum score is 0 points。 |
| 1.2 Local government services | 10 | The evaluation is based on three items for the level of government services with respect to the resource allocation for ordinary PV power plants by local governments: 1. Competitive allocation (3 points):where a competitive system, that is the same all throughout the province, is used in the allocation of ordinary PV power plants, 3 points are awarded;where a competitive system is used for allocation only at the level of municipalities or counties, respectively, 2 points or 1 point are awarded。 2. Additional conditions (4 points):where there are no additional conditions in the resource allocation for ordinary PV power plants set by local governments (including hidden charges, industry localization and other additional requirements), 4 points are awarded;For each additional requirement, 1 point is deducted, with a minimum score of 0 points。 3. Service evaluation (3 points):A comprehensive score is based on the situation reflected in a business survey, market complaints, and media supervision。 |
|
| 1.3 Grid enterprise services | 10 | The evaluation is based on two items for preparation phase work and construction/repurchase of supporting grid infrastructure: 1. Preparation phase services (5 points):where a reply on the measures for power grid access is received on average within a period of 3 months or less, 5 points are awarded;for each additional month, 1 point is deducted, with a minimum score of 0 points。 2. Construction/repurchase of supporting grid infrastructure (5 points):Where the provincial-level grid enterprise constructs supporting infrastructure for the delivery of electricity within a timely manner, AND where the repurchase of this infrastructure is completed within one year in case the investment in such infrastructure is done by the power generation enterprise, 5 points are awarded;Where the provincial-level grid enterprise does not construct supporting infrastructure for the delivery of electricity within a timely manner, OR where the repurchase of this infrastructure is not completed within one year in case the investment in such infrastructure is done by the power generation enterprise, 3 points are awarded;Where the provincial-level grid enterprise does not construct supporting infrastructure for the delivery of electricity within a timely manner, AND where the repurchase of this infrastructure is not completed within one year in case the investment in such infrastructure is done by the power generation enterprise, 0 points are awarded。 |
|
| 1.4 Level of national electricity subsidies | 5 | Evaluation is done on the basis of the level of subsidies per kWh for newly built PV power plants within the year, with all administrative areas ordered from low to high: Those within the top 10 percent, are awarded 5 points; Those outside the top 10 percent, but within the top 30%, are awarded 4 points; Those outside the top 30 percent, but within the top 50%, are awarded 3 points; Those outside the top 50 percent, but within the top 70%, are awarded 2 points; Those outside the top 70 percent, but within the top 90%, are awarded 1 point; Those in the bottom 10 percent, are awarded 0 points。 |
|
| 1.5 Average reduction in subsidy for projects with feed-in tariff determined in competitive allocation | 5 | Evaluation is done on the basis of the reduction in the feed-in tariff for PV power plants awarded in competitive allocation within the year the evaluation occurs, compared to the current local benchmark feed-in tariff: where the difference is 0.05 RMB/kWh or more, 5 points are awarded; where the difference is 0.04 RMB/kWh or more, but less than 0.05 RMB/kWh, 4 points are awarded; where the difference is 0.03 RMB/kWh or more, but less than 0.04 RMB/kWh, 3 points are awarded; where the difference is 0.02 RMB/kWh or more, but less than 0.03 RMB/kWh, 2 points are awarded; where the difference is 0.01 RMB/kWh or more, but less than 0.02 RMB/kWh, 1 point is awarded; where the difference is less than 0.01 RMB/kWh, or where no annual development quota was allocated, 0 points are awarded。 |
|
| 1.6 Level of local government subsidies | 5 | Evaluation is done on the basis of subsidy policies introduced by the various levels of local government: Where the provincial-level government has introduced a subsidy policy, 2 points are added; Where the municipal-level government has introduced a subsidy policy, 2 points are added; Where the county-level government has introduced a subsidy policy, 1 point is added; The maximum score is 5 points。 |
|
| 2. Risk evaluation index | 2.1 Level of PV curtailment | 30 | Evaluation is done on the basis of of the level of curtailment of PV in combination with the fulfillment of the minimum guaranteed full-load hours purchased: Where there is no curtailment of PV, 30 points are awarded; Where curtailment of PV is below 2%, 24 points are awarded; Where curtailment of PV exceeds 2%, but is below 4%, 18 points are awarded; Where curtailment of PV exceeds 4%, but is below 6%, 12 points are awarded; Where curtailment of PV exceeds 6%, but is below 8%, 6 points are awarded; Where curtailment of PV exceeds 8%, but is below 10%, 0 points are awarded; Where curtailment of PV exceeds 10%, this immediately leads to a red evaluation result。 Where the number of minimum guaranteed full-load hours purchased as determined by the national government is fulfilled, but where the curtailment rates give a score of less than 18 points, 18 points are nonetheless awarded。 |
| 2.2 Market consumption risk | 10 | Evaluation is done on the basis of curtailment of other forms of renewable electricity: Where there is no curtailment of hydropower and wind power, 10 points are awarded; Where the utilization rate of hydropower is 95% or more, and the curtailment rate of wind power is less than 10%, 7 points are awarded; Where the utilization rate of hydropower is 95% or less, or the curtailment rate of wind power is 10% or more, 4 points are awarded; Where the utilization rate of hydropower is 95% or less, and the curtailment rate of wind power is 10% or more, 0 points are awarded; Where there is no curtailment of PV, but a score of less than 7 points is achieved on this item, 7 points are nonetheless awarded。 |
|
| 2.3 Level of implementation of the guaranteed full purchase policy | 10 | Evaluation is done on the basis of implementation of the policy for minimum guaranteed full-load hours purchased and on participation in electricity market trading: Where all electricity generated is purchased under the provisions of the policy for minimum guaranteed full-load hours purchased, 10 points are awarded; Where the local government has introduced policies, with electricity generation covered by the policy for minimum guaranteed full-load hours purchased does not participate in trading, but the electricity generation exceeding this minimum does participate in trading, eight points are awarded; Where the local government has introduced policies, with electricity generation covered by the policy for minimum guaranteed full-load hours purchased being below the minimum determined by the national government, and where the share of electricity with guaranteed prices is 90% or 80% of total generation, 6 or 4 points are awarded, respectively;where it is less than 80%, 0 points are awarded。 |
Notes:1. The assessment of the fulfillment of guaranteed full-load hours purchased is done on the basis of annual full-load hours utilized。The annual full-load hours utilized is based on a statistical calculation including PV power stations that had fully completed construction, were connected to the grid and were operational in the selected administrative region, in the year previous to the evaluation. The number of annual full-load hours utilized = the total volume of electricity put on to the grid by PV power plants included in the statistics / the total generating capacity of PV power plants included in the statistics。
2. The PV curtailment rate is based on a statistical calculation including PV power stations that had fully completed construction, were connected to the grid and were operational in the selected administrative region, in the year previous to the evaluation. The PV curtailment rate = A/(A+B)×100%, in which A is the total volume of electricity curtailed from power plants included in the statistics, and B is the total volume of electricity put on to the grid by PV power plants included in the statistics。
3. In the table, where it says "above, below, within, outside, or exceeding" a certain number, the range includes the exact value of this number, where it says "less than" the range excludes the exact value of this number。
Annex 2
2016 PV power generation market environment monitor and evaluation result for different administrative areas (Trial)
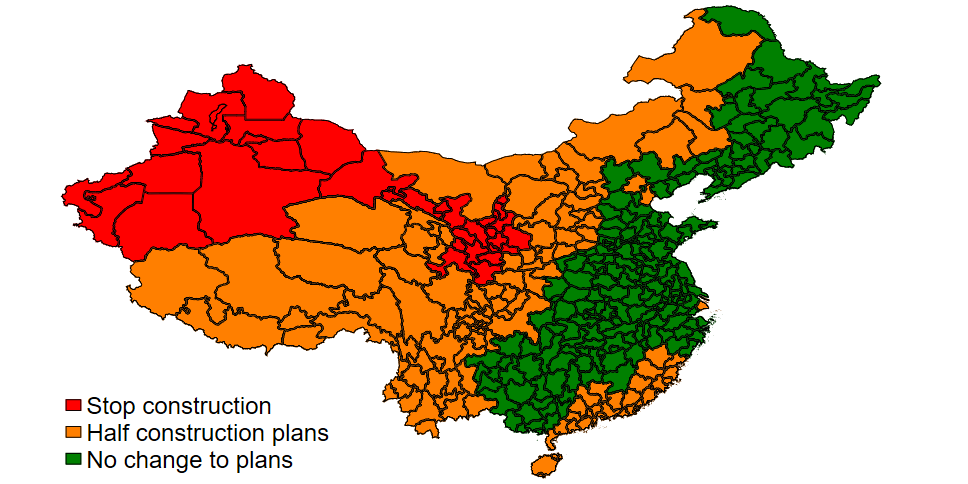
[map added by China Energy Portal]
| Resource category area | Area | Competitiveness evaluation index | Risk evaluation index | Total score (100) | Evaluation result | |||||||||
| Land conditions (15) | Local gov't services (10) | Grid company services (10) | Level of national electricity subsidies (5) | Average reduction in subsidy for projects with feed-in tariff determined in competitive allocation (5) | Level of local government subsidies (5) | Competitiveness evaluation index subtotal (50) | Level of PV curtailment (30) | Market consumption risk (10) | Level of implementation of the guaranteed full purchase policy (10) | Risk evaluation index subtotal (50) | ||||
| Class I resource area | Ningxia | 15 | 9 | 5 | 3 | 0 | 0 | 32 | 6 | 4 | 4 | 14 | 46 | Red |
| Qinghai: Haixi | 15 | 10 | 7 | 5 | 0 | 0 | 37 | 6 | 10 | 10 | 26 | 63 | Orange | |
| Gansu: Jiayuguan, Wuwei, Zhangye, Jiuquan, Dunhuang, Jinchang | 15 | 0 | 5 | 5 | 0 | 0 | 25 | / | 4 | 0 | 4 | 29 | Red | |
| Xinjiang: Hami, Tacheng, Altay, Karamay | 15 | 0 | 5 | 3 | 0 | 0 | 23 | / | 4 | 6 | 10 | 33 | Red | |
| Inner Mongolia: areas outside of Chifeng, Tongliao, Xing'an league, Hulunbeier | 11 | 10 | 10 | 4 | 0 | 0 | 35 | 12 | 4 | 10 | 26 | 61 | Orange | |
| Class II resource area | Beijing | 2 | 0 | 10 | 4 | 0 | 0 | 16 | 30 | 7 | 10 | 47 | 63 | Orange |
| Tianjin | 2 | 0 | 10 | 4 | 0 | 0 | 16 | 30 | 10 | 10 | 50 | 66 | Orange | |
| Heilongjiang | 15 | 10 | 5 | 5 | 5 | 0 | 40 | 30 | 4 | 10 | 44 | 84 | Green | |
| Jilin | 12 | 10 | 8 | 4 | 0 | 2 | 36 | 30 | 4 | 10 | 44 | 80 | Green | |
| Liaoning | 15 | 10 | 5 | 4 | 0 | 2 | 36 | 30 | 4 | 10 | 44 | 80 | Green | |
| Sichuan | 14 | 8 | 5 | 5 | 0 | 0 | 32 | 30 | 4 | 10 | 44 | 76 | Orange | |
| Yunnan | 10 | 10 | 8 | 3 | 0 | 0 | 31 | 30 | 4 | 4 | 38 | 69 | Orange | |
| Inner Mongolia: Chifeng, Tongliao, Xing'an league, Hulunbeier | 11 | 10 | 10 | 2 | 0 | 0 | 33 | 30 | 4 | 10 | 44 | 77 | Orange | |
| Hebei: Chengde, Zhangjiakou, Tangshan, Qinhuangdao | 10 | 10 | 8 | 4 | 5 | 2 | 39 | 24 | 7 | 10 | 41 | 80 | Green | |
| Shanxi: Datong, Shuozhou, Xinzhou | 10 | 10 | 5 | 3 | 3 | 0 | 31 | 30 | 7 | 8 | 45 | 76 | Orange | |
| Shaanxi: Yulin, Yan'an | 10 | 10 | 4 | 3 | 5 | 2 | 34 | 12 | 7 | 8 | 27 | 61 | Orange | |
| Qinghai: areas outside of Class I resource areas | 11 | 10 | 7 | 3 | 0 | 0 | 31 | 18 | 10 | 10 | 38 | 69 | Orange | |
| Gansu: areas outside of Class I resource areas | 15 | 0 | 5 | 2 | 0 | 0 | 22 | / | 4 | 0 | 4 | 26 | Red | |
| Xinjiang: areas outside of Class I resource areas | 15 | 0 | 5 | 1 | 0 | 0 | 21 | / | 4 | 6 | 10 | 31 | Red | |
| Class III resource area | Hebei: areas outside of Class II resource areas | 10 | 10 | 8 | 1 | 5 | 2 | 36 | 30 | 7 | 10 | 47 | 83 | Green |
| Shanxi: areas outside of Class II resource areas | 10 | 10 | 5 | 0 | 4 | 1 | 30 | 30 | 7 | 8 | 45 | 75 | Orange | |
| Shaanxi: areas outside of Class II resource areas | 10 | 10 | 4 | 0 | 5 | 2 | 31 | 24 | 7 | 8 | 39 | 70 | Orange | |
| Shanghai | 2 | 7 | 10 | 2 | 0 | 4 | 25 | 30 | 10 | 10 | 50 | 75 | Orange | |
| Jiangsu | 10 | 10 | 10 | 1 | 0 | 4 | 35 | 30 | 10 | 10 | 50 | 85 | Green | |
| Zhejiang | 2 | 10 | 10 | 2 | 3 | 5 | 32 | 30 | 10 | 10 | 50 | 82 | Green | |
| Anhui | 10 | 10 | 10 | 1 | 4 | 2 | 37 | 30 | 10 | 10 | 50 | 87 | Green | |
| Fujian | 10 | 5 | 10 | 1 | 0 | 0 | 26 | 30 | 10 | 10 | 50 | 76 | Orange | |
| Jiangxi | 10 | 10 | 10 | 2 | 0 | 2 | 34 | 30 | 10 | 10 | 50 | 84 | Green | |
| Shandong | 9 | 10 | 8 | 1 | 0 | 2 | 30 | 30 | 10 | 10 | 50 | 80 | Green | |
| Henan | 10 | 10 | 9 | 1 | 0 | 0 | 30 | 30 | 10 | 10 | 50 | 80 | Green | |
| Hubei | 10 | 10 | 9 | 2 | 0 | 2 | 33 | 30 | 10 | 10 | 50 | 83 | Green | |
| Hunan | 10 | 10 | 9 | 3 | 0 | 2 | 34 | 30 | 10 | 10 | 50 | 84 | Green | |
| Guangdong | 8 | 10 | 5 | 4 | 0 | 0 | 27 | 30 | 10 | 10 | 50 | 77 | Orange | |
| Guangxi | 10 | 10 | 9 | 2 | 3 | 0 | 34 | 30 | 10 | 10 | 50 | 84 | Green | |
| Hainan | 9 | 10 | 5 | 3 | 0 | 0 | 27 | 30 | 10 | 10 | 50 | 77 | Orange | |
| Chongqing | 10 | 7 | 8 | 2 | 0 | 0 | 27 | 30 | 10 | 10 | 50 | 77 | Orange | |
| Guizhou | 12 | 10 | 9 | 0 | 0 | 0 | 31 | 30 | 10 | 10 | 50 | 81 | Green | |
| Tibet | 15 | 4 | 9 | 0 | 0 | 0 | 28 | 30 | 10 | 10 | 50 | 78 | Orange | |
Notes:1. "/" indicates an immediate red evaluation result。
2. This table contains the trial results for the year 2016。2017 is considered a transitional period, with trial results given to have various administrative areas consider strengthening their work for the administrative management of the PV industry。


