
All translations on this site are unofficial and provided for reference purpose only.
To view translations, select English under Step 1 (at the right of the screen). Not every item is (fully) translated. If you’re still seeing Chinese, you can use machine translation, under Step 2, to make sense of the rest.
Want to help translate? Switch to English under Step 1, and check ‘edit translation’ (more explanation in the FAQ). Even if you translate just a few lines, this is still very much appreciated! Remember to log in if you would like to be credited for your effort. If you’re unsure where to start translating, please see the list of Most wanted translations.
Establishment of a monitoring and evaluation system for the market environment for PV plant development (Trial) (Draft for comments)
Original title: 国家能源局综合司征求《关于建立光伏电站开发市场环境监测评价体系(试行)的通知》意见的函
Links: Original source (in Chinese) (link);
Document that set the minimum guaranteed full-load hours (link);
2016 Evaluation report for the implementation of the “minimum guaranteed full-load hours” policy (link).
Establishment of a monitoring and evaluation system for the market environment for PV plant development (Trial) (Draft for comments)
In order to optimize the environment for investment and development of photovoltaic power generation, to urge provinces to create favorable conditions that will reduce cost and improve efficiency for PV power generation, to guide rational investment from PV power plant developers, and to promote the sustained and healthy development of the PV industry, it was decided to establish a market environment monitoring and investment guidance system for PV power plant development。Notice is hereby given of relevant matters and requirements as follows:
1. The National Energy Administration will carry out market environment monitoring and evaluation for investment and development in PV power plants in provinces, autonomous regions and directly controlled municipalities (including the Xinjiang Production and Construction Corps, similarly hereinafter)。The monitoring and evaluation system consists of risk indicators and competitiveness indicators。Evaluation results are divided into:green, orange and red。Monitoring and evaluation will occur annually, with a monitoring and evaluation report published in the first quarter of the following year。Evaluation criteria are included in Annex 1。Monitoring and evaluation results for each administrative area are included in Annex 2。
2. There are three risk category indicators。1. An indicator for achievement of guaranteed full-load hours, which mainly evaluates whether the administrative area reached the required number of guaranteed full-load hours as determined by the national government。Where there are multiple grid companies or multiple applicable benchmark feed-in tariffs for renewable electricity within a single provincial level administrative area, evaluation can be subdivided。2. A market consumption risk indicator, which mainly evaluates the local risk for consumption of PV power based on the curtailment of renewable electricity。3. An indicator for the participation of renewable energy in power trading, which mainly evaluates the share in total power production of renewable power required to participate in electricity market transactions by the local government's electric power management departments, power trading institutions, and power grid companies, as well as the resulting drop in electricity prices。
3. There are 6 competitiveness indicators。1. A land resource indicator, which mainly evaluates the types of land used and the land use costs。2. A local government service indicator, which mainly evaluates whether the local government has drafted administrative measures for the management of photovoltaic power generation in accordance with relevant national policies, administrative measures and scientific reasoning, as well as whether there are hidden charges or industry requirements。3. A grid enterprise services indicator, which mainly evaluates whether the local power grid enterprises constructs supporting grid infrastructure in a timely manner, or whether it reimburses PV power generation projects for self-invested grid infrastructure for the delivery of electricity in a timely manner, etc.。4. An indicator for the level of subsidies from the national government; the average feed-in tariff for newly built power plants in the administrative area in the previous year。5. An indicator for the average reduction in subsidy for projects with feed-in tariff determined in competitive allocation, including the reduction in national government subsidy for projects in PV bases as organized under the direction of the National Energy Administration in the respective administrative area。6. An indicator for the Level of local government subsidies; PV subsidy policies implemented by the provincial government and lower level local governments。
4. Monitoring and evaluation results are published annually。In the case that there have been significant changes to electricity prices or other key conditions, or where relevant major policies are introduced or revised, supplementary results will be pubilshed。
5. Results from the monitoring and evaluation system for the market environment for PV plant development is used to guide provinces, autonomous regions and directly controlled municipalities in PV power plant development and investment。For areas where the monitoring and evaluation result is green, indicating a low risk for development of PV power plants, the NEA will maintain the planned scale of PV power plant development for that area, or appropriately adjust plans;for areas where the monitoring and evaluation result is orange, the NEA will appropriately adjust plans for newly installed PV power plant capacity, under the premise that it is ensured that measures are taken to improve the investment and development environment;for areas where the monitoring and evaluation result is red, the NEA will in principle not allocate an annual quota for new installations in the year in which the monitoring and evaluation result is published, and the energy authorities of local governments should suspend the registration of new PV power plant projects。
Annex:1. Monitoring and evaluation methods and scoring criteria for the market environment for PV power plant development
2. 2016 monitoring and evaluation results for the market environment for PV power plant development in different areas
Annex 1:
Monitoring and evaluation methods and scoring criteria for the market environment for PV power plant development
1. Evaluation method
(A) Evaluation of the level of risk
The evaluation result for risk rating is the sum of the scores of each evaluation index item。评价结果分为高、中、低三个等级(低于15、15-25、>25分),分别对应高风险、中度风险、低风险三个等级。
(B) Evaluation of the level of competitiveness
The evaluation result for competitiveness rating is the sum of the scores of each evaluation index item。评价结果分为两个等级(>45分、≤45分),分别对应竞争力较强和竞争力较弱两个等级。
(C) Overall evaluation result
When the competitiveness rating is strong, and the risk rating is low or moderate, the overall evaluation result is green。
When the competitiveness rating is strong, and the risk rating is high, the overall evaluation result is orange。
When the competitiveness rating is weak, and the risk rating is low or moderate, the overall evaluation result is orange。
When the competitiveness rating is weak, and the risk rating is high, the overall evaluation result is red。
2. Evaluation standard
| Item | Content | Score | Evaluation standard | |
| Risk indicators | Achievement of guaranteed full-load hours | 25 | Evaluated on the basis of achievement of the number of guaranteed full-load hours in the previous year: | |
| Achieving the guaranteed number of full-load hours, or, for areas for which no guaranteed number of full-load hours has been determined, having curtailment of no more than 5% (25); | ||||
| Realized number of full-load hours is not more than 5% below the guaranteed number of annual full-load hours, for areas for which a guaranteed number of full-load hours has been determined (15); | ||||
| Achieving less than 95% of the guaranteed full-load hours. Failing this criterion immediately leads to the overall evaluation result being red。 | ||||
| Market consumption risk | 5 | Evaluated on the basis of curtailment of renewable energy (hydropower, wind power, PV power generation) in the previous year: | ||
| Hydropower curtailment of less than 5%, wind power curtailment of less than 10%, and PV curtailment of less than 5% (5); | ||||
| When curtailment rates exceed either 5% for hydropower, or 10% for wind power, or 5% for PV power generation (-5); | ||||
| Participation of renewable energy in power trading | 5 | Guaranteed purchase of the full amount of renewable electricity (excluding hydro);or where the local government has introduced a policy where the amount of electricity subject to guaranteed purchase does not participate in power trading, and the amount not subject to guaranteed purchase does participate in power trading (5 points); | ||
| Where the local government has introduced a policy where the guaranteed number of hours and guaranteed prices is below the number of hours with guaranteed purchase as determined by the national government, and the remainder participates in power trading, but where the share of electricity subject to guaranteed purchase is not below 60% (-3 points); | ||||
| Where the local government has introduced a policy where the full amount of renewable electricity (excluding hydro) participates in power trading, or where the share of electricity subject to guaranteed purchase is below 60% (-5 points)。 | ||||
| Competitiveness indicators | Land types and costs | 20 | Evaluated on the basis of a survey of land use costs and taxes for PV power plants, in the previous year: | |
| Rent is below 300 RMB/mu [667 m2] of land, no urban land use tax is levied, does not belong to agricultural land for which arable land use taxes are levied (20 points); | ||||
| Rent exceeds 300 RMB/mu [667 m2] of land, no urban land use tax is levied (10 points); | ||||
| Urban land use tax is levied, or arable land use taxes are levied for the entire plot of land (0 points)。 | ||||
| Grid services | 10 | Where the provincial power grid in a timely manner constructs supporting grid infrastructure in accordance with the projects' construction cycle, where previous investment in grid infrastructure for delivery of the electricity has already been reimbursed, or where there exists a clear plan for such reimbursement (10 points); | ||
| Where the power grid delays construction of supporting grid infrastructure, but where reimbursement of self-invested infrastructure for delivery of the electricity occurs in a timely manner (5 points); | ||||
| Where the power grid delays both construction of supporting grid infrastructure, and reimbursement of self-invested infrastructure for delivery of the electricity (0 points)。 | ||||
| Government services | 10 | The local government has formulated administrative management regulations for PV power generation, it provides one-stop market services, and there are no hidden charges or charges, or other behavior that increases the corporate burden (10 points); | ||
| The local government has formulated administrative management regulations for PV power generation, and there are hidden charges or industry requirements (5 points) ; | ||||
| There are hidden fees or charges, or other behavior that increases the corporate burden (-5 points)。 | ||||
| Level of national government feed-in tariff | 10 | Evaluated on the basis of the feed-in tariff for newly built power plants in the previous year: | ||
| Less than 0.35 RMB/kWh (10 points); | ||||
| 0.36-0.40 RMB/kWh (6 points); | ||||
| 0.41-0.45 RMB/kWh (3 points); | ||||
| More than 0.45 RMB/kWh (0 points)。
To be adjusted according to the electricity price reduction for new projects as listed below。 |
||||
| Average reduction in subsidy for projects with feed-in tariff determined in competitive allocation | 5 | Score based on the difference between the feed-in tariff determined in competitive allocation and the local benchmark feed-in tariff for PV in a certain year: | ||
| Difference of more than 0.05 RMB/kWh (including 0.05) (5 points); | ||||
| Difference of 0.03-0.05 RMB/kWh (including 0.03) (4 points); | ||||
| Difference of 0.01-003 RMB/kWh (including 0.01) (2 points); | ||||
| Difference of less than 0.01 RMB/kWh (0 points)。 | ||||
| Level of local government subsidies | 10 | Evaluated on the basis of the sum of the number of administrative areas with subsidies, with the score for municipality and county levels converted for the share of municipalities and counties with subsidies, and where a full score equals 10 points: | ||
| Provincial level subsidy +6 points; | ||||
| Municipal level subsidy +2 points; | ||||
| County level subsidy +1 point; |
Annex 2:
2016 monitoring and evaluation results for the market environment for PV power plant development in different areas (Trial evaluation)
| Resource category area | Area | Risk indicators | Competitiveness indicators | Evaluation result | Development guidance | ||||||||||
| Achievement of guaranteed full-load hours (25) | Market consumption risk (5) | Participation of renewable energy in power trading (5) | Risk indicators score | Land types and costs (20) | Local gov't services (10) | Grid company services (10) | Level of national gov't feed-in tariff (10) | Average reduction in subsidy for projects with feed-in tariff determined in competitive allocation (5) | Level of local gov't subsidies (10) | Competitiveness indicators score | Risk rating | Competitiveness rating | |||
| Class I resource area | Ningxia | 0 | -5 | -3 | -8 | 10 | 10 | 5 | 6 | 0 | 0 | 31 | High | Weak | Red |
| Qinghai: Haixi | 0 | -5 | 5 | 0 | 10 | 10 | 5 | 10 | 0 | 0 | 35 | High | Weak | Red | |
| Gansu: Jiayuguan, Wuwei, Zhangye, Jiuquan, Dunhuang, Jinchang | 0 | -5 | -3 | -8 | 10 | 10 | 5 | 10 | 0 | 0 | 35 | High | Weak | Red | |
| Xinjiang: Hami, Tacheng, Altay, Karamay | 0 | -5 | -5 | -10 | 10 | -5 | 5 | 6 | 0 | 0 | 16 | High | Weak | Red | |
| Inner Mongolia: areas outside of Chifeng, Tongliao, Xing'an league, Hulunbeier | 15 | -5 | 5 | 15 | 10 | -5 | 5 | 6 | 0 | 0 | 16 | Medium | Weak | Orange | |
| Class II resource area | Beijing | 25 | 5 | 5 | 35 | 10 | 10 | 10 | 6 | 0 | 0 | 36 | Low | Weak | Orange |
| Tianjin | 25 | 5 | 5 | 35 | 10 | 10 | 10 | 6 | 0 | 0 | 36 | Low | Weak | Orange | |
| Heilongjiang | 25 | -5 | 5 | 25 | 20 | 10 | 5 | 6 | 0 | 0 | 41 | Medium | Weak | Orange | |
| Jilin | 25 | -5 | 5 | 25 | 20 | 10 | 5 | 6 | 0 | 6 | 47 | Medium | Strong | Green | |
| Liaoning | 25 | -5 | 5 | 25 | 20 | 10 | 5 | 6 | 0 | 0 | 41 | Medium | Weak | Orange | |
| Sichuan | 25 | -5 | 5 | 25 | 20 | 10 | 5 | 10 | 0 | 0 | 45 | Medium | Weak | Orange | |
| Yunnan | 25 | -5 | -5 | 15 | 10 | 10 | 5 | 3 | 0 | 0 | 28 | Medium | Weak | Orange | |
| Inner Mongolia: Chifeng, Tongliao, Xing'an league, Hulunbeier | 25 | -5 | 5 | 25 | 20 | -5 | 5 | 3 | 0 | 0 | 23 | Medium | Weak | Orange | |
| Hebei: Chengde, Zhangjiakou, Tangshan, Qinhuangdao | 15 | 5 | 5 | 25 | 20 | 10 | 5 | 6 | 2 | 6 | 49 | Medium | Strong | Green | |
| Shanxi: Datong, Shuozhou, Xinzhou | 25 | 5 | 5 | 35 | 10 | 10 | 5 | 3 | 2 | 0 | 30 | Low | Weak | Orange | |
| Shaanxi: Yulin, Yan'an | 15 | -5 | -3 | 7 | 20 | 10 | 10 | 3 | 0 | 6 | 49 | High | Strong | Orange | |
| Qinghai: areas outside of Class I resource areas | 25 | 5 | 5 | 35 | 10 | 10 | 5 | 3 | 0 | 0 | 28 | Low | Weak | Orange | |
| Gansu: areas outside of Class I resource areas | 0 | -5 | -3 | -8 | 10 | 10 | 5 | 3 | 0 | 0 | 28 | High | Weak | Red | |
| Xinjiang: areas outside of Class I resource areas | 0 | -5 | -5 | -10 | 10 | -5 | 5 | 0 | 0 | 0 | 10 | High | Weak | Red | |
| Class III resource area | Hebei: areas outside of Class II resource areas | 25 | 5 | 5 | 35 | 10 | 10 | 5 | 0 | 2 | 6 | 33 | Low | Weak | Orange |
| Shanxi: areas outside of Class II resource areas | 25 | 5 | 5 | 35 | 10 | 5 | 5 | 0 | 4 | 2 | 26 | Low | Weak | Orange | |
| Shaanxi: areas outside of Class II resource areas | 25 | 5 | -3 | 27 | 10 | 10 | 10 | 0 | 0 | 6 | 36 | Low | Weak | Orange | |
| Shanghai | 25 | 5 | 5 | 35 | 10 | 10 | 10 | 3 | 0 | 0 | 33 | Low | Weak | Orange | |
| Jiangsu | 25 | 5 | 5 | 35 | 20 | 10 | 10 | 0 | 0 | 8 | 48 | Low | Strong | Green | |
| Zhejiang | 25 | 5 | 5 | 35 | 0 | 10 | 10 | 3 | 2 | 10 | 35 | Low | Weak | Orange | |
| Anhui | 25 | 5 | 5 | 35 | 20 | 10 | 10 | 0 | 4 | 6 | 50 | Low | Strong | Green | |
| Fujian | 25 | 5 | 5 | 35 | 20 | 5 | 10 | 0 | 0 | 0 | 35 | Low | Weak | Orange | |
| Jiangxi | 25 | 5 | 5 | 35 | 20 | 10 | 10 | 3 | 0 | 6 | 49 | Low | Strong | Green | |
| Shandong | 25 | 5 | 5 | 35 | 20 | 10 | 10 | 0 | 0 | 6 | 46 | Low | Strong | Green | |
| Henan | 25 | 5 | 5 | 35 | 20 | 10 | 10 | 0 | 0 | 0 | 40 | Low | Weak | Orange | |
| Hubei | 25 | 5 | 5 | 35 | 20 | 10 | 10 | 3 | 0 | 6 | 49 | Low | Strong | Green | |
| Hunan | 25 | 5 | 5 | 35 | 20 | 10 | 10 | 6 | 0 | 6 | 52 | Low | Strong | Green | |
| Guangdong | 25 | 5 | 5 | 35 | 10 | 10 | 10 | 6 | 0 | 0 | 36 | Low | Weak | Orange | |
| Guangxi | 25 | 5 | 5 | 35 | 20 | 10 | 10 | 3 | 2 | 0 | 45 | Low | Weak | Orange | |
| Hainan | 25 | 5 | 5 | 35 | 20 | 10 | 10 | 3 | 0 | 0 | 43 | Low | Weak | Orange | |
| Chongqing | 25 | 5 | 5 | 35 | 20 | 10 | 10 | 0 | 0 | 0 | 40 | Low | Weak | Orange | |
| Guizhou | 25 | 5 | 5 | 35 | 20 | 10 | 10 | 0 | 0 | 0 | 40 | Low | Weak | Orange | |
| Tibet | 25 | 5 | 5 | 35 | 20 | 10 | 10 | 0 | 0 | 0 | 40 | Low | Weak | Orange | |
2016 monitoring and evaluation results for the market environment for PV power plant development in different areas (Trial evaluation)
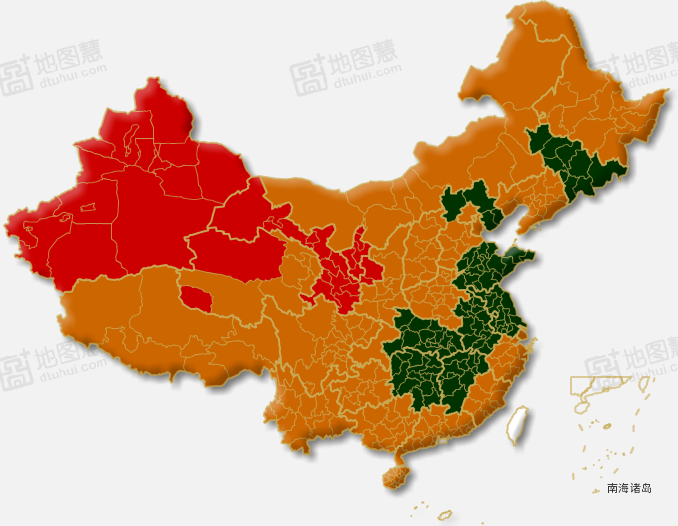
[Map added by China Energy Portal; created on Dituhui.com (link)]


