
All translations on this site are unofficial and provided for reference purpose only.
To view translations, select English under Step 1 (at the right of the screen). Not every item is (fully) translated. If you’re still seeing Chinese, you can use machine translation, under Step 2, to make sense of the rest.
Want to help translate? Switch to English under Step 1, and check ‘edit translation’ (more explanation in the FAQ). Even if you translate just a few lines, this is still very much appreciated! Remember to log in if you would like to be credited for your effort. If you’re unsure where to start translating, please see the list of Most wanted translations.
2016 wind power installations and production by province
Original title: 2016年风电并网运行情况
Links: Original CN (link). Same statistics for (2017) (2015) (2014) (2013).
In 2016, the country's wind power sector maintained a healthy growth momentum. Newly installed capacity of wind power was 19.3 GW, with cumulative installed capacity reaching 149 GW, accounting for 9% of the total installed power generation capacity. Wind power electricity generation was 241 TWh, equal to 4% of total electricity generation。In 2016, nationwide average productivity was 1742 full-load hours, an increase of 14 hours, with curtailment of 49.7 TWh。
In 2016, provinces with relatively high annual additions were Yunnan (3.25 GW), Hebei (1.66 GW), Jiangsu (1.49 GW), Inner Mongolia (1.32 GW) and Ningxia (1.2 GW). Productivity was relatively high in Fujian (2503 full-load hours), Guangxi (2365 hours), Sichuan (2247 hours) and Yunnan (2223 hours)。
In 2016, wind power curtailment was most serious in Gansu (43%, or 10.4 TWh curtailed), Xinjiang (38%, 13.7 TWh), Jilin (30%, 2.9 TWh) Inner Mongolia (21%, 12.4 TWh)。
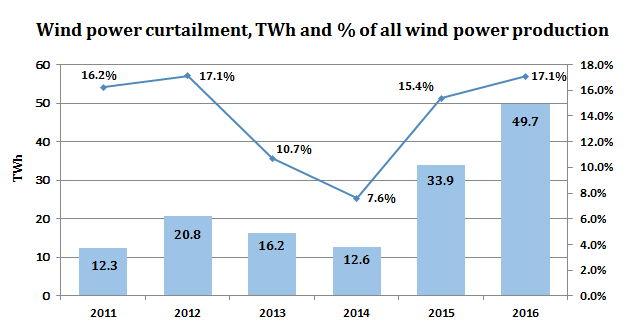
[Graph added by China Energy Portal]
Annex:
2016 Wind power operating statistics
| Province (autonomous region, municipality) | Newly installed grid-connected generation capacity (MW) | Cumulative grid-connected generation capacity (MW) | Electricity production (GWh) | Curtailment (GWh) | Curtailment (%) | Productivity (full-load hours) |
| Total | 19,300 | 148,640 | 241,000 | 49,700 | 1,742 | |
| Beijing | 40 | 190 | 300 | 1,750 | ||
| Tianjin | 0 | 290 | 600 | 2,075 | ||
| Hebei | 1,660 | 11,880 | 21,900 | 2,200 | 9% | 2,077 |
| Shanxi | 1,020 | 7,710 | 13,500 | 1,400 | 9% | 1,936 |
| Shandong | 1,180 | 8,390 | 14,700 | 1,869 | ||
| Inner Mongolia | 1,320 | 25,570 | 46,400 | 12,400 | 21% | 1,830 |
| Liaoning | 560 | 6,950 | 12,900 | 1,900 | 13% | 1,929 |
| Jilin | 610 | 5,050 | 6,700 | 2,900 | 30% | 1,333 |
| Heilongjiang | 580 | 5,610 | 8,800 | 2,000 | 19% | 1,666 |
| Shanghai | 100 | 710 | 1,400 | 2,162 | ||
| Jiangsu | 1,490 | 5,610 | 9,800 | 1,980 | ||
| Zhejiang | 150 | 1,190 | 2,300 | 2,161 | ||
| Anhui | 410 | 1,770 | 3,400 | 2,109 | ||
| Fujian | 420 | 2,140 | 5,000 | 2,503 | ||
| Jiangxi | 410 | 1,080 | 1,900 | 2,114 | ||
| Henan | 130 | 1,040 | 1,800 | 1,902 | ||
| Hubei | 660 | 2,010 | 3,500 | 2,063 | ||
| Hunan | 610 | 2,170 | 3,900 | 2,125 | ||
| Chongqing | 50 | 280 | 500 | 1,600 | ||
| Sichuan | 520 | 1,250 | 2,100 | 2,247 | ||
| Shaanxi | 800 | 2,490 | 2,800 | 200 | 7% | 1,951 |
| Gansu | 250 | 12,770 | 13,600 | 10,400 | 43% | 1,088 |
| Qinghai | 220 | 690 | 1,000 | 1,726 | ||
| Ningxia | 1,200 | 9,420 | 12,900 | 1,900 | 13% | 1,553 |
| Xinjiang | 850 | 17,760 | 22,000 | 13,700 | 38% | 1,290 |
| Tibet | 0 | 10 | 1,908 | |||
| Guangdong | 220 | 2,680 | 5,000 | 1,848 | ||
| Guangxi | 240 | 670 | 1,300 | 2,365 | ||
| Hainan | 0 | 310 | 600 | 1,781 | ||
| Guizhou | 390 | 3,620 | 5,500 | 1,806 | ||
| Yunnan | 3,250 | 7,370 | 14,800 | 600 | 4% | 2,223 |
Notes:1. Capacity unit:MW;Generation unit:GWh;
2. Statistics on capacity, power generation, and full-load hours are from the China Electricity Council;
3. Statistics on curtailment are from the National Renewable Energy Center, and relevant grid enterprises。


