
All translations on this site are unofficial and provided for reference purpose only.
To view translations, select English under Step 1 (at the right of the screen). Not every item is (fully) translated. If you’re still seeing Chinese, you can use machine translation, under Step 2, to make sense of the rest.
Want to help translate? Switch to English under Step 1, and check ‘edit translation’ (more explanation in the FAQ). Even if you translate just a few lines, this is still very much appreciated! Remember to log in if you would like to be credited for your effort. If you’re unsure where to start translating, please see the list of Most wanted translations.
2017 Q1-3 wind power installations and production by province
Original title: 2017年前三季度风电并网运行情况
Links: Source document (in Chinese) (link). Same stats for last year (link).
In the months January to September, nationwide newly installed capacity was 9.7 GW. By the end of September, cumulative installed grid-connected wind power capacity reached 157 GW, a growth of 13% in cumulative capacity at the end of September last year;in the months January to September, total wind power generation was 212.8 TWh, an increase of 26% on the same period last year;average productivity was 1386 full-load hours, an increase of 135 hours;in the months January to September, total wind power curtailment was 29.55 TWh, a decrease of 10.3 TWh compared with same period last year. Wind power curtailment rates were down 6.7 percentage points year on year, realizing a "double reduction" in both total curtailment and curtailment rates。
From January to September, provinces with relatively large additions to installed capacity were Shandong (1140 MW), Qinghai (1090 MW), Hebei (750 MW), Henan (720 MW) and Shanxi (660 MW)。Provinces with relatively high wind power productivity were Yunnan (1897 full-load hours), Sichuan (1761 hours), Chongqing (1755 hours), Shanghai (1633 hours) and Fujian (1610 hours);Provinces with relatively high wind power productivity were Guangdong (1040 full-load hours), Gansu (1068 hours), Hainan (1189 hours) and Henan (1199 hours)。
2017 Q3 Newly installed capacity
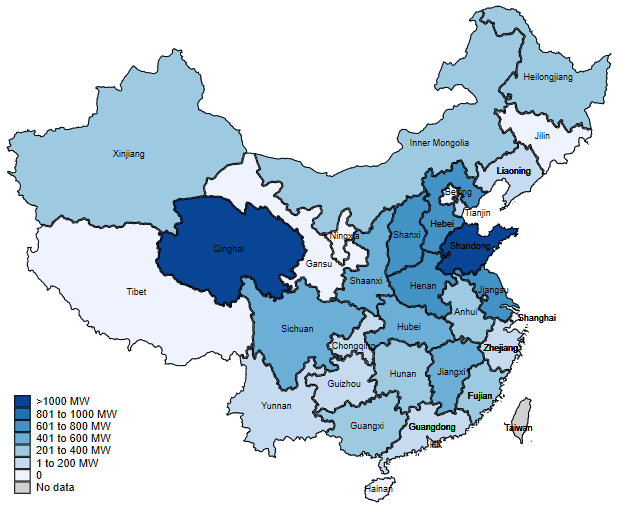
[map added by China Energy Portal]
2017 Q1-3 wind power installations and power production |
||||||
| Province | New grid-connected capacity (MW) | Total grid-connected capacity (MW) | Power generation (GWh) | Wind power curtailment (GWh) | Wind power curtailment rate (%) | Full load hours |
| Total | 9,700 | 157,200 | 212,800 | 29,550 | 1386 | |
| Beijing | 0 | 190 | 200 | 1284 | ||
| Tianjin | 10 | 280 | 400 | 1570 | ||
| Hebei | 750 | 11,740 | 17,700 | 1,400 | 7% | 1521 |
| Shanxi | 660 | 8,420 | 10,500 | 940 | 8% | 1287 |
| Shandong | 1,140 | 9,970 | 11,500 | 1267 | ||
| Inner Mongolia | 240 | 26,330 | 37,700 | 5,910 | 14% | 1432 |
| Liaoning | 100 | 7,000 | 10,700 | 750 | 7% | 1531 |
| Jilin | 0 | 5,050 | 6,300 | 1,480 | 19% | 1246 |
| Heilongjiang | 260 | 5,680 | 7,600 | 1,050 | 12% | 1351 |
| Shanghai | 0 | 710 | 1,200 | 1633 | ||
| Jiangsu | 650 | 6,260 | 8,200 | 1398 | ||
| Zhejiang | 80 | 1,310 | 1,700 | 1403 | ||
| Anhui | 230 | 2,050 | 2,900 | 1484 | ||
| Fujian | 300 | 2,390 | 3,700 | 1610 | ||
| Jiangxi | 600 | 1,620 | 2,100 | 1361 | ||
| Henan | 720 | 1,890 | 2,000 | 1199 | ||
| Hubei | 420 | 2,380 | 3,600 | 1578 | ||
| Hunan | 300 | 2,470 | 3,500 | 1504 | ||
| Chongqing | 50 | 330 | 600 | 1755 | ||
| Sichuan | 550 | 1,590 | 2,500 | 1761 | ||
| Shaanxi | 560 | 2,290 | 2,900 | 140 | 4% | 1459 |
| Gansu | 0 | 12,770 | 13,600 | 6,740 | 33% | 1068 |
| Qinghai | 1,090 | 1,010 | 1,300 | 1453 | ||
| Ningxia | 0 | 9,420 | 11,300 | 380 | 3% | 1210 |
| Xinjiang | 300 | 18,060 | 24,700 | 10,200 | 29.30% | 1377 |
| Tibet | 0 | 10 | 0 | 1165 | ||
| Guangdong | 130 | 3,300 | 3,400 | 1040 | ||
| Guangxi | 290 | 1,260 | 1,500 | 1489 | ||
| Hainan | 0 | 310 | 400 | 1189 | ||
| Guizhou | 100 | 3,620 | 4,900 | 1385 | ||
| Yunnan | 150 | 7,490 | 14,200 | 570 | 4% | 1897 |
Notes:1. Wind power curtailment and curtailment rates from dispatch data from grid companies, other data as provided by the CEC; 2. Statistics for Shaanxi do not include data from the Shaanxi Regional Electric Power Group Co., Ltd


