
All translations on this site are unofficial and provided for reference purpose only.
To view translations, select English under Step 1 (at the right of the screen). Not every item is (fully) translated. If you’re still seeing Chinese, you can use machine translation, under Step 2, to make sense of the rest.
Want to help translate? Switch to English under Step 1, and check ‘edit translation’ (more explanation in the FAQ). Even if you translate just a few lines, this is still very much appreciated! Remember to log in if you would like to be credited for your effort. If you’re unsure where to start translating, please see the list of Most wanted translations.
2018 Q1&2 wind power installations and production by province
Original title: 2018年上半年风电并网运行情况
Links: Source document (in Chinese) (link). Same stats for (2017) (2016).
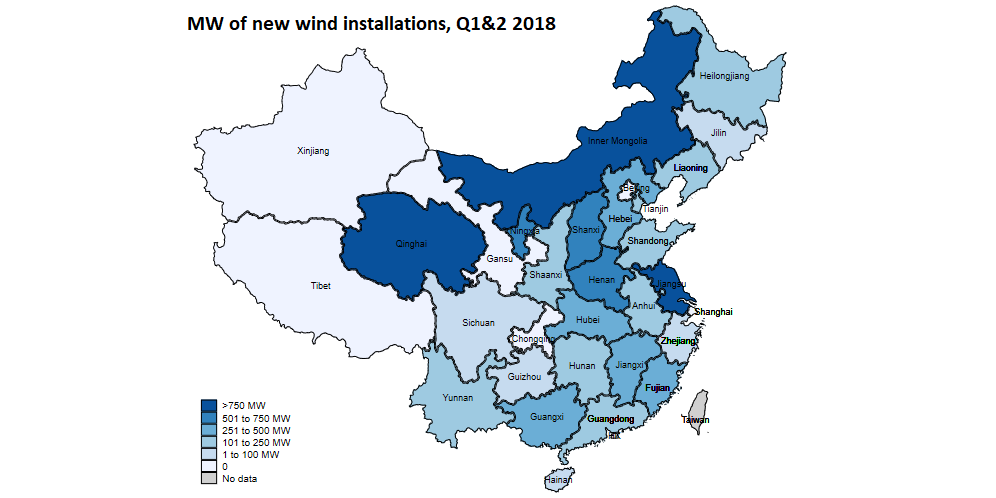
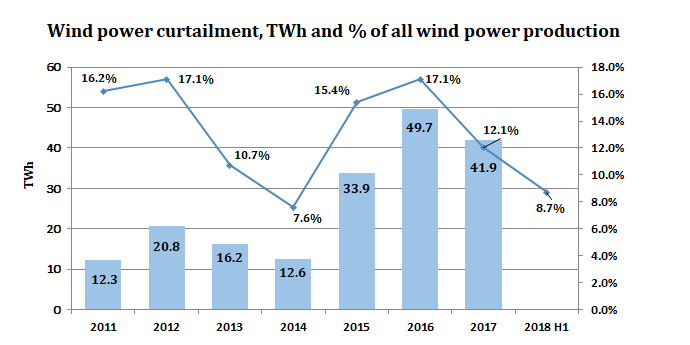
According to industry statistics, from January to June 2018, nationwide newly installed wind power capacity was 7.94 GW. By the end of June, cumulative wind power capacity reached 171.6 GW;From January to June, total wind power generation was 191.7 TWh, an increase of 28.7% year-on-year;average productivity was 1143 full-load hours, an increase of 159 hours year-on-year;from January to June, curtailment of wind power was 18.2 TWh, down 5.3 TWh year-on-year。
From January to June, provinces with relatively high newly installed capacity were Jiangsu province (920 MW), Inner Mongolia (910 MW), Qinghai (850 MW), Henan (660 MW), Shanxi (590 MW), and Ningxia (540 MW)。Provinces with relatively high productivity were Yunnan (1592 full-load hours), Liaoning (1335 hours), Fujian (1302 hours), Hebei (1297 hours), and Sichuan (1296 hours)。
2018H1 wind power operating statistics
| Province (autonomous region, municipality) | Grid-connected capacity, additions | Grid-connected capacity, cumulative | Power production | Curtailment | Wind power curtailment (% of all) | Full-load hours |
| Total | 7,940 | 171,610 | 191,700 | 18,180 | 8.7% | 1143 |
| Beijing | 0 | 190 | 190 | 1026 | ||
| Tianjin | 230 | 520 | 440 | 1238 | ||
| Hebei | 460 | 12,270 | 15,700 | 440 | 2.7% | 1297 |
| Shanxi | 590 | 9,310 | 11,320 | 60 | 0.6% | 1263 |
| Inner Mongolia | 910 | 27,610 | 31,420 | 6,310 | 16.7% | 1179 |
| Liaoning | 140 | 7,250 | 9,580 | 130 | 1.3% | 1335 |
| Jilin | 50 | 5,100 | 5,530 | 360 | 6.1% | 1093 |
| Heilongjiang | 150 | 5,850 | 6,300 | 330 | 5.0% | 1099 |
| Shanghai | 0 | 710 | 910 | 1278 | ||
| Jiangsu | 920 | 7,480 | 8,280 | 1292 | ||
| Zhejiang | 90 | 1,420 | 1,430 | 1049 | ||
| Anhui | 140 | 2,310 | 2,510 | 1105 | ||
| Fujian | 260 | 2,780 | 3,410 | 1302 | ||
| Jiangxi | 390 | 2,080 | 1,990 | 976 | ||
| Shandong | 200 | 10,810 | 13,000 | 1226 | ||
| Henan | 660 | 2,990 | 2,890 | 996 | ||
| Hubei | 310 | 2,840 | 3,200 | 1153 | ||
| Hunan | 160 | 2,790 | 3,130 | 1158 | ||
| Guangdong | 130 | 3,480 | 3,040 | 874 | ||
| Guangxi | 390 | 1,890 | 2,100 | 1227 | ||
| Hainan | 10 | 320 | 270 | 804 | ||
| Chongqing | 0 | 330 | 330 | 990 | ||
| Sichuan | 80 | 2,180 | 2,800 | 1296 | ||
| Guizhou | 30 | 3,720 | 3,840 | 70 | 1.8% | 1049 |
| Yunnan | 130 | 8,320 | 13,100 | 30 | 0.2% | 1592 |
| Tibet | 0 | 10 | 10 | 1146 | ||
| Shaanxi | 110 | 3,740 | 3,730 | 100 | 2.6% | 1034 |
| Gansu | 0 | 12,820 | 11,720 | 3,010 | 20.5% | 918 |
| Qinghai | 850 | 2,470 | 1,870 | 20 | 0.8% | 799 |
| Ningxia | 540 | 9,960 | 10,110 | 170 | 1.6% | 1038 |
| Xinjiang | 0 | 18,060 | 17,500 | 7,130 | 28.9% | 969 |
Notes:1. Unit of installed capacity:MW;Generation unit:GWh;
2. Statistics are as dispatched by the grid companies. The main difference between these statistics and the CEC statistics is that wind power installations below 6000 kW and in the Shaanxi regional electric power grid are included.。


