
All translations on this site are unofficial and provided for reference purpose only.
To view translations, select English under Step 1 (at the right of the screen). Not every item is (fully) translated. If you’re still seeing Chinese, you can use machine translation, under Step 2, to make sense of the rest.
Want to help translate? Switch to English under Step 1, and check ‘edit translation’ (more explanation in the FAQ). Even if you translate just a few lines, this is still very much appreciated! Remember to log in if you would like to be credited for your effort. If you’re unsure where to start translating, please see the list of Most wanted translations.
2018 wind power installations and production by province
Original title: 2018年风电并网运行情况
Links: Source document (in Chinese) (link). Same statistics for (2017) (2016) (2015) 2014) (2013).
Newly installed capacity 2018 (MW)
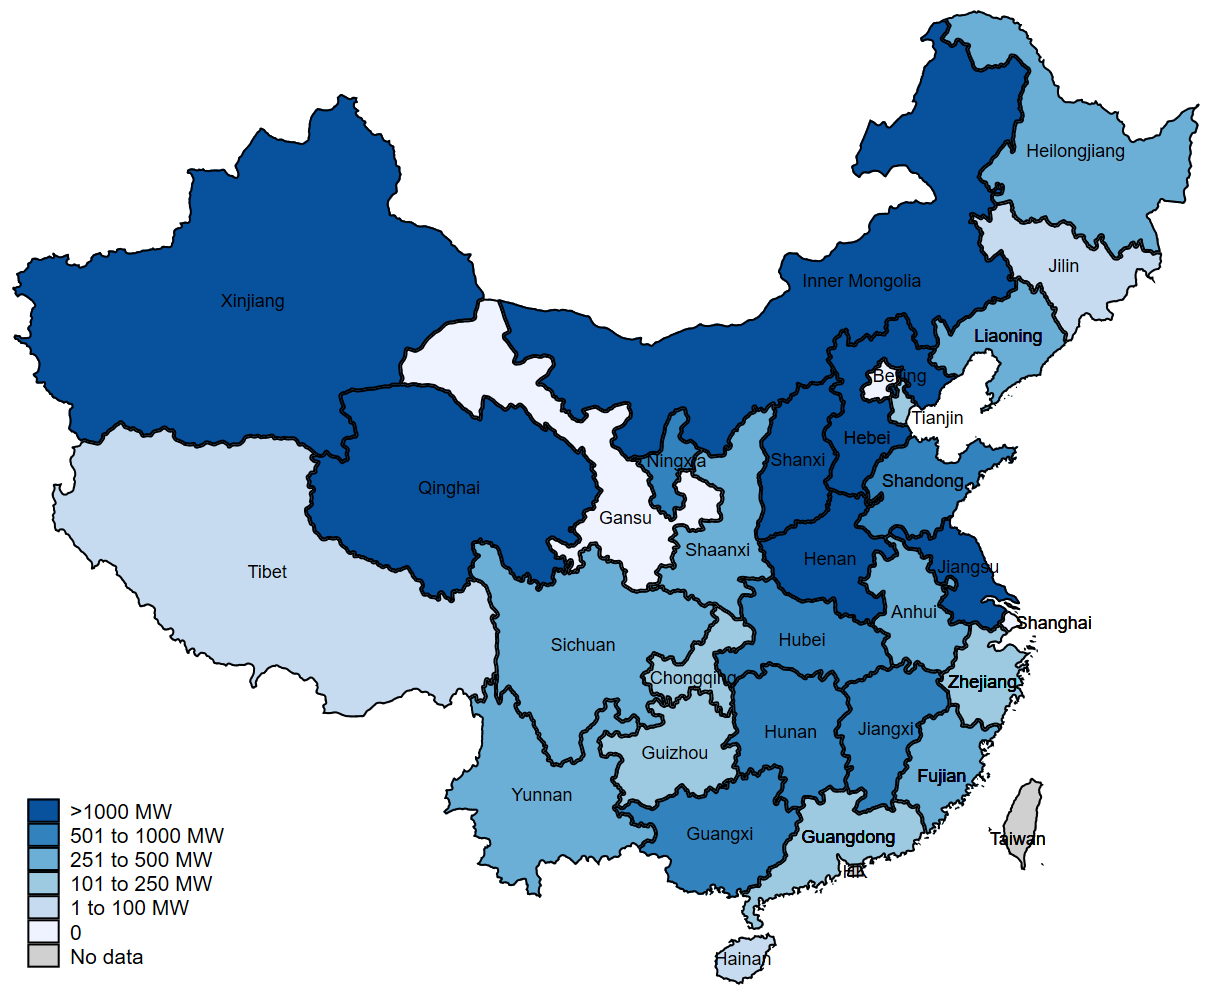
[graphs added by China Energy Portal]
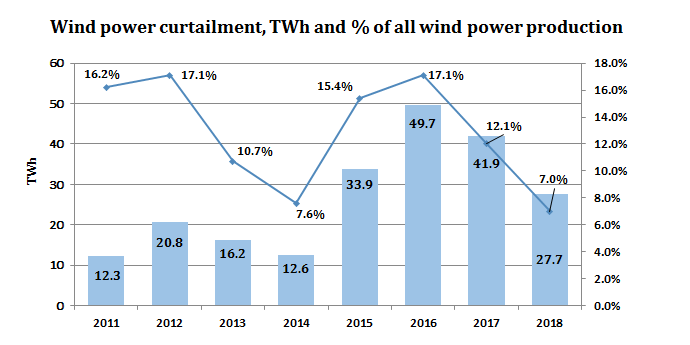
According to industry statistics, in 2018, newly installed wind power capacity was 20.59 GW, with cumulative installed capacity reaching 184 GW, accounting for 9.7% of total power generation capacity。Wind power generation in 2018 was 366 TWh, accounting for 5.2% of total power generation, up 0.4 percentage points from 2017。Nationwide average productivity of wind power installations was 2095 full-load hours, up 147 hours on 2017;Curtailment was 27.7 TWh, down 14.2 TWh from 2017. Average wind power curtailment rates were 7 percent, down 5 percentage points from 2017, a significant relief in curtailment conditions。
In 2018, provinces with relatively high wind power productivity were Yunnan (2654 full-load hours), Fujian (2587 hours), Shanghai (2489 hours) and Sichuan (2333 hours)。
In 2018, areas with curtailment exceeding 8% were Xinjiang (curtailment rate of 23%, or 10.7 TWh, Gansu (curtailment rate of 19%, or 5.4 TWh), and Inner Mongolia (curtailment rate of 10%, or 7.2 TWh)。These three provinces (regions) together had total curtailment of 23.3 TWh, accounting for 84% of nationwide curtailment。
2018 grid-connected wind power operational statistics
| Province (autonomous region, municipality) | Newly installed grid-connected generation capacity (MW) | Cumulative grid-connected generation capacity (MW) | Electricity production (GWh) | Wind power curtailment (GWh) | Wind power curtailment (% of all) | Full-load hours | 2018 wind power curtailment targets committed to by provinces (autonomous regions, municipalities) |
| Total | 20,590 | 184,260 | 366,000 | 27,700 | 7.0% | 2095 | |
| Beijing | 0 | 190 | 300 | 1866 | 0 | ||
| Tianjin | 230 | 520 | 800 | 1830 | 0 | ||
| Hebei | 2,100 | 13,910 | 28,300 | 1,550 | 5.2% | 2276 | 6.7% (Northern Hebei renewable power avg.) |
| Shanxi | 1,710 | 10,430 | 21,200 | 240 | 1.1% | 2196 | 4.2% (renewable power avg.) |
| Inner Mongolia | 1,990 | 28,690 | 63,200 | 7,240 | 10.3% | 2204 | 12% |
| Liaoning | 500 | 7,610 | 16,500 | 160 | 1.0% | 2265 | 8% |
| Jilin | 90 | 5,140 | 10,500 | 770 | 6.8% | 2057 | — |
| Heilongjiang | 280 | 5,980 | 12,500 | 580 | 4.4% | 2144 | — |
| Shanghai | 0 | 710 | 1,800 | 2489 | 0 | ||
| Jiangsu | 2,090 | 8,650 | 17,300 | 2216 | 0 | ||
| Zhejiang | 150 | 1,480 | 3,100 | 2173 | 0 | ||
| Anhui | 290 | 2,460 | 5,000 | 2150 | Guarantee 10%, strive for 0% | ||
| Fujian | 480 | 3,000 | 7,200 | 2587 | 0 | ||
| Jiangxi | 560 | 2,250 | 4,100 | 1940 | 0 | ||
| Shandong | 850 | 11,460 | 21,400 | 300 | 1.4% | 1971 | Circa 2% |
| Henan | 2,350 | 4,680 | 5,700 | 1746 | 0 | ||
| Hubei | 780 | 3,310 | 6,400 | 2159 | Guarantee 10%, strive for 0% | ||
| Hunan | 850 | 3,480 | 6,000 | 2054 | 4% (renewable power avg.) | ||
| Guangdong | 220 | 3,570 | 6,300 | 1770 | 0 | ||
| Guangxi | 580 | 2,080 | 4,200 | 2294 | 0 | ||
| Hainan | 30 | 340 | 500 | 1524 | — | ||
| Chongqing | 170 | 500 | 800 | 1968 | 0 | ||
| Sichuan | 430 | 2,530 | 5,500 | 2333 | 0 | ||
| Guizhou | 170 | 3,860 | 6,800 | 80 | 1.1% | 1821 | 3% |
| Yunnan | 380 | 8,570 | 22,000 | 2654 | Guarantee 10%, strive for 0% | ||
| Tibet | 2 | 10 | 10 | 1863 | — | ||
| Shaanxi | 420 | 4,050 | 7,200 | 160 | 2.2% | 1959 | Reduce curtailment by 1.8%, maintain at below 2.2% |
| Gansu | 0 | 12,820 | 23,000 | 5,400 | 19.0% | 1772 | 23% |
| Qinghai | 1,050 | 2,670 | 3,800 | 60 | 1.6% | 1524 | 0 |
| Ningxia | 690 | 10,110 | 18,700 | 440 | 2.3% | 1888 | — |
| Xinjiang | 1,150 | 19,210 | 35,900 | 10,690 | 22.9% | 1951 | 26% |
[newly added installations added by China Energy Portal, based on same stats for 2017]
Notes: 1. Unit of installed capacity:MW;Generation unit:GWh;
2. Source of statistics on grid-connected installed capacity, power production, and productivity is the CEC;
3. Sources of statistics on curtailment and curtailment rates are the National Renewable Energy Center, and relevant grid enterprises。Blank cells indicates no curtailment occurred。
4.各省承诺的全年弃风率控制目标为各省(区、市)在落实《解决弃水弃风弃光问题实施方案》工作方案中承诺的2018年全年弃风率控制目标,“–”表示工作方案中未提出弃风控制目标。


