
All translations on this site are unofficial and provided for reference purpose only.
To view translations, select English under Step 1 (at the right of the screen). Not every item is (fully) translated. If you’re still seeing Chinese, you can use machine translation, under Step 2, to make sense of the rest.
Want to help translate? Switch to English under Step 1, and check ‘edit translation’ (more explanation in the FAQ). Even if you translate just a few lines, this is still very much appreciated! Remember to log in if you would like to be credited for your effort. If you’re unsure where to start translating, please see the list of Most wanted translations.
2021 Q2 electricity & other energy statistics
Original title: 2021年1-6月全国电力工业统计数据一览表
Links: Original source (in Chinese) (link). Same statistics for (Q2 2020) (Q2 2019) (Q2 2018) (Q2 2017) (Q2 2016) (Q2 2015) (Q2 2014) (Q2 2013) (Q2 2012) (Q2 2011) (Q2 2010) (Q2 2009).
[* Thermal is a combination of coal, gas, oil, and biomass; these sources are not split out in the statistics provided by the CEC. Data is for year-to-date, i.e., total production in the first 6 months of 2021 vs. total production in the first 6 months of 2020]
2021年1-6月全国电力工业统计数据一览表
| Indicator | Unit | Year to date | Change | ||||
| % | ± | % point | |||||
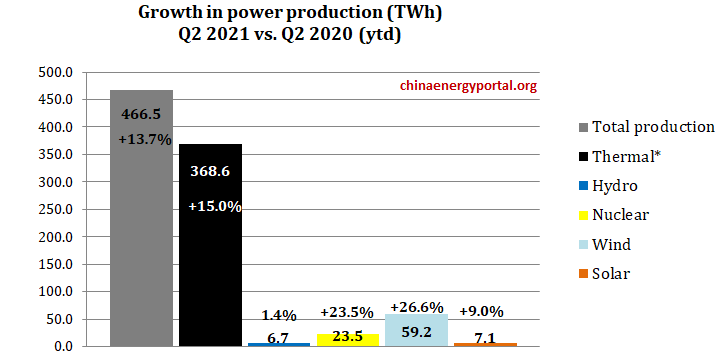
| National total power production | GWh | 3,871,700 | 13.7 | ||||
| Of which: Hydropower | GWh | 482,700 | 1.4 | ||||
| Thermal power | GWh | 2,826,200 | 15.0 | ||||
| Nuclear power | GWh | 195,100 | 13.7 | ||||
| National total power consumption | GWh | 3,933,900 | 16.2 | ||||
| Of which: primary industry power cons. | GWh | 45,100 | 20.6 | ||||
| Secondary industry power cons. | GWh | 2,661,000 | 16.6 | ||||
| — | — | Of which: industrial power cons. | GWh | 2,612,700 | 16.5 | ||
| Tertiary industry power cons. | GWh | 671,000 | 25.8 | ||||
| Household power cons. | GWh | 556,800 | 4.5 | ||||
| Total installed capacity (units >6MW) | MW | 2,256,600 | 9.5 | ||||
| Of which: Hydropower | MW | 37,785 | 4.7 | ||||
| Thermal power | MW | 1,266,580 | 4.1 | ||||
| Nuclear power | MW | 52,160 | 6.9 | ||||
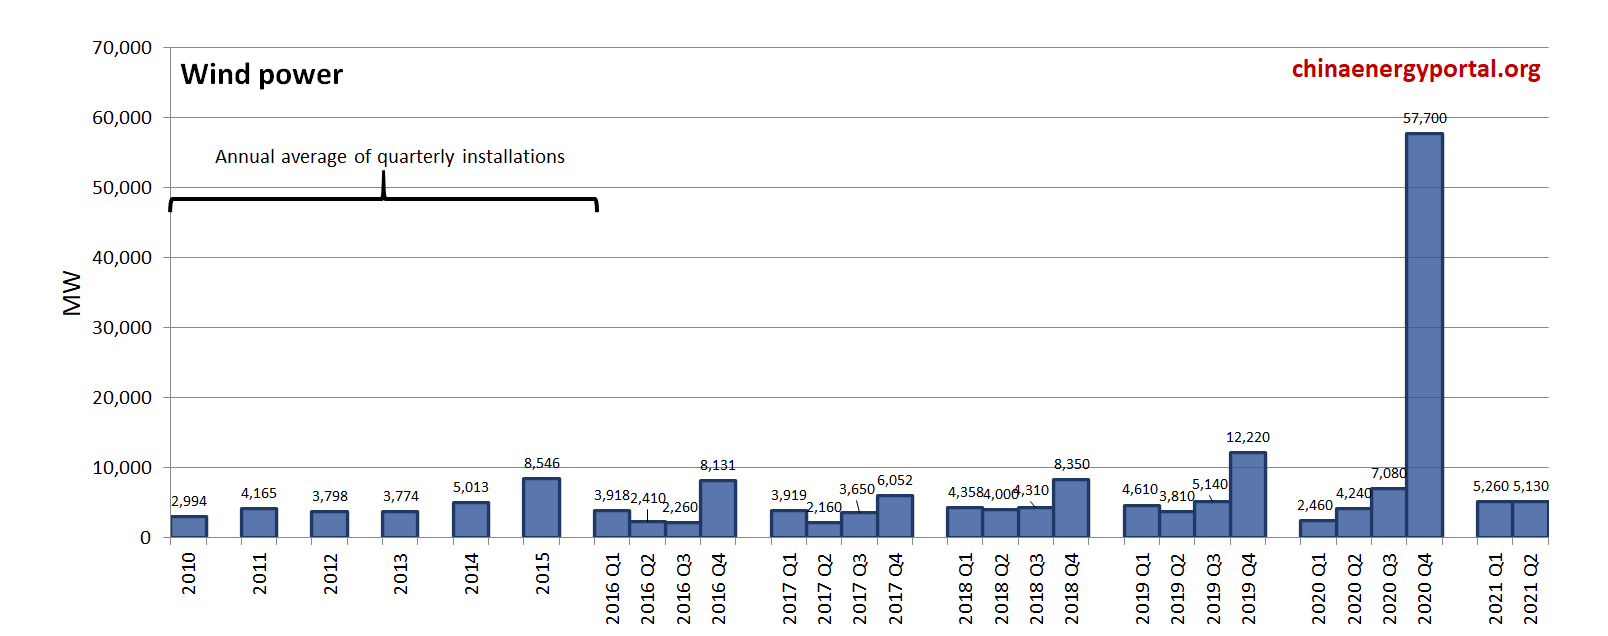
| Wind power | MW | 291,920 | 34.7 | ||||
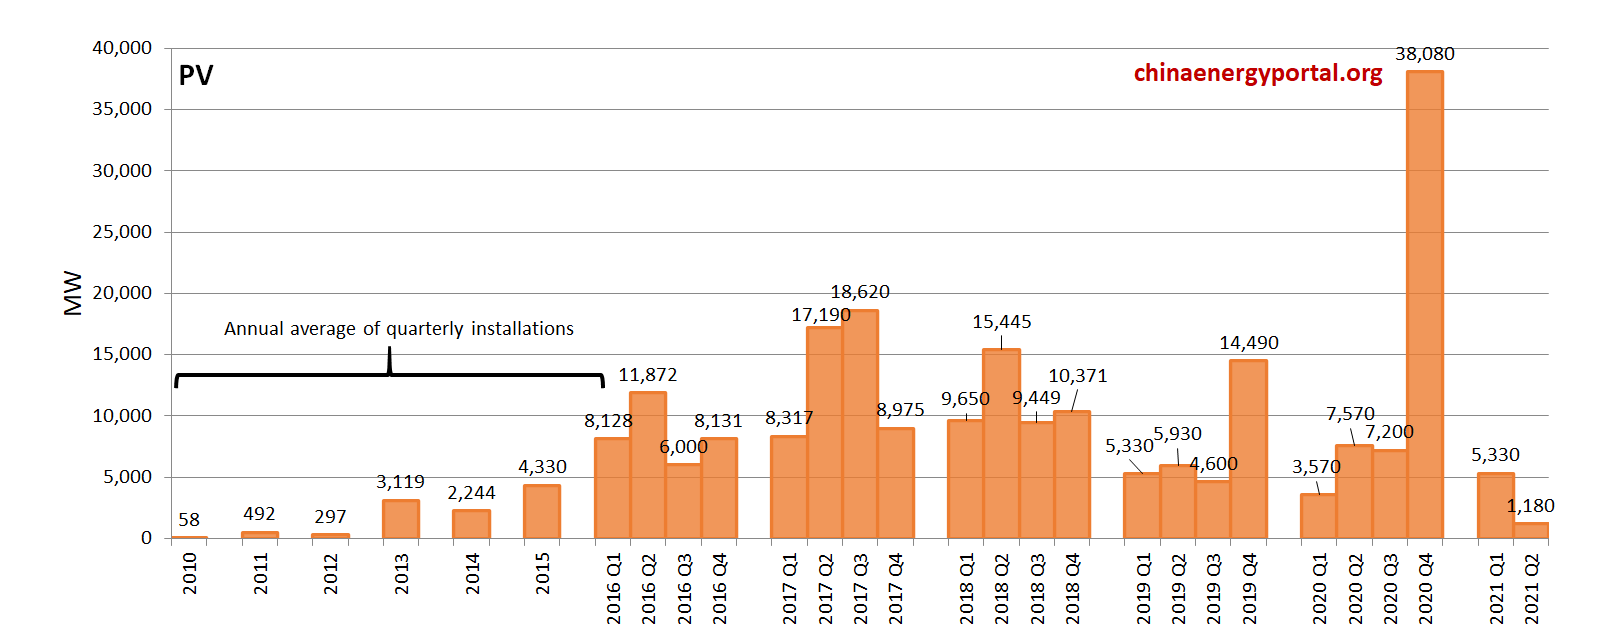
| Solar power | MW | 267,610 | 23.7 | ||||
| Coal cons. (avg.) | g/kWh | 301.4 | -0.8 | ||||
| Transmission and distribution losses | % | 4.4 | -0.2 | ||||
| National heat supply | TJ | 2,974,620 | 6.6 | ||||
| Coal consumed for national heat supply | kt | 178,600 | 9.1 | ||||
| National power supply | GWh | 3,415,500 | 17.7 | ||||
| National power sales | GWh | 3,266,100 | 17.9 | ||||
| Full load hours (national avg.) | hours | 1,853 | 119 | ||||
| Of which:Hydro power | hours | 1496 | -33 | ||||
| Thermal power | hours | 2186 | 231 | ||||
| Nuclear power | hours | 3,805 | 286 | ||||
| Wind power | hours | 1,212 | 88 | ||||
| Solar power | hours | 660 | -3 | ||||
| Power plant own consumption (nat. avg.) | % | 4.5 | -0.10 | ||||
| Of which:Hydro power | % | 0.3 | 0.0 | ||||
| Thermal power | % | 5.7 | -0.1 | ||||
| Completed investment in power projects | Million RMB | 189,300 | 8.9 | ||||
| Of which:Hydro power | Million RMB | 47,500 | 19.1 | ||||
| Thermal power | Million RMB | 20,200 | 10.3 | ||||
| Nuclear power | Million RMB | 22,600 | 44.3 | ||||
| Wind power | Million RMB | 82,600 | -3.2 | ||||
| Solar power | Million RMB | 16,500 | 12.2 | ||||
| Completed investment in power grid construction projects | Million RMB | 173,400 | 4.7 | ||||
| Installed generation capacity, additions | MW | 51,870 | 14920 | ||||
| Of which:Hydro power | MW | 8,120 | 4000 | ||||
| Thermal power | MW | 17,570 | 1250 | ||||
| Nuclear power | MW | 2,270 | 2270 | ||||
| Wind power | MW | 10,840 | 4520 | ||||
| Solar power | MW | 13,010 | 2860 | ||||
| New 220 kV and above substation equipment capacity (AC) | MVA | 137330 | 28390 | ||||
| Network length (>220 kV), additions | km | 19882 | 53170 | ||||
Notes: 1. The source of the above statistics is the National Energy Administration and the National Bureau of Statistics。
2. From May 2018 onwards, industries are classified in accordance with the "Notice on the revision of the regulations for classifications of the three industries (2012) (NBS [2018] No. 74)" and data has been adjusted accordingly. In order to ensure data comparability, the data for the previous period has been reclassified according to the same standard。
3. Data for "Completed investment in power grid construction projects" is major power generation companies investment data。
4. Data for newly installed capacity of thermal power includes emergency reserves for peak regulation capacity。
Additional statistics from NBS:
Original title: 2021年6月份规模以上工业增加值增长4.8%
Links: Original source (in Chinese) (link).
| January-June | |||
| Amount | YoY Increase | ||
| (%) | |||
| Vehicles | 1000 units | 12,790 | 26.4 |
| Of which:Sedan | 1000 units | 4,560 | 25 |
| Sport utility vehicles (SUV) | 1000 units | 4,565 | 29.1 |
| Of which:“New Energy Vehicles" | 1000 units | 1,284 | 205 |
| Generators (power generation equipment) | MW | 70,150 | 17.4 |
| Raw coal | kt | 1,948,670 | 6.4 |
| Coking coal | kt | 237,090 | 4.1 |
| Crude oil | kt | 99,320 | 2.4 |
| Crude oil processing capacity | kt | 353,350 | 10.7 |
| Natural gas | Million cubic meter | 104,500 | 10.9 |
| Power production | GWh | 3,871,700 | 13.7 |
| Thermal power production | GWh | 2,826,200 | 15 |
| Hydro power production | GWh | 482,700 | 1.4 |
| Nuclear power production | GWh | 195,100 | 13.7 |
| Wind power production | GWh | 281,900 | 26.6 |
| Solar power production | GWh | 85,800 | 9 |


