
All translations on this site are unofficial and provided for reference purpose only.
To view translations, select English under Step 1 (at the right of the screen). Not every item is (fully) translated. If you’re still seeing Chinese, you can use machine translation, under Step 2, to make sense of the rest.
Want to help translate? Switch to English under Step 1, and check ‘edit translation’ (more explanation in the FAQ). Even if you translate just a few lines, this is still very much appreciated! Remember to log in if you would like to be credited for your effort. If you’re unsure where to start translating, please see the list of Most wanted translations.
Circular on 2021 risk and early warning for coal power planning and construction
Original title: 国家能源局关于发布2021年煤电规划建设风险预警的通知 国能发电力〔2018〕44号
Links: Source document (in Chinese) (link). Same document for other years: (2023) (2022) (2021) (2020).
国家能源局文件
国能发电力〔2018]44号
NEA Circular on 2021 risk and early warning for coal power planning and construction
各省、自治区、直辖市、新疆生产建设兵团发展改革委(能源局),各派出能源监管机构,中电联,国家电网公司、南方电网公司,华能、大唐、华电、国电投、国家能源集团,中咨公司、电力规划设计总院:
为深入学习贯彻习近平新时代中国特色社会主义思想和党的十九大精神,推进供给侧结构隆改革,积极稳妥做好2018年化解煤电过剩产能工作,按照《关于推进供给侧结构性改革防范化解煤电产能过剩风险的意见》(发改能源(2017]141)4号)、(2018年煤电化解过剩产能工作要点》(发改运行〔2018)554号)等相关文件要求,国家能源局会同相关单位进一步完善了2021年煤电规划建设风险预警机制。Currently notice is given of the following。
I. The risk and early warning indicator system for coal-fired power planning and construction is divided into indicators for economics, installed capacity redundancy, and resource constraint indicators。Of these, the early warning indicators for the economics of coal power construction is a guiding indicator, which reflects the local economics of building coal-fired power projects, and provides decision-making reference for planning and construction of coal power projects by power generation enterprises;The early warning indicator for coal-fired power plant installed capacity redundancy is a binding indicator, reflecting the local overcapacity of coal-fired power generation capacity and power supply;The resource constraint indicator is a binding indicator, reflecting the local feasibility of planning and building coal-fired power projects。
2. The early warning indicator for the economics of coal-fired power construction is based on the expected return on investment of new coal-fired power projects in each province, autonomous region and directly-controlled municipality in 2021, and is divided into three levels: red, orange, and green。A red warning is issued when return on investment is lower than the current interest rate on medium to long-term national bonds;an orange warning is issued when return on investment is between the current interest rate on medium to long-term national bonds and a normal rate of return (generally 8% for power generation projects);a green warning is issued when return on investment exceeds the normal rate of return。For the calculation method and results for expected return on investment for coal-fired power generation projects, see Annex 1 and 2
3. The early-warning index of installed capacity of coal-fired power plant is based on the power systems' backup rates of various provinces, autonomous regions and municipalities directly under the central government in 2021, and is divided into three levels: red, orange, and green。A red warning is issued when there is obvious redundancy in the installed capacity of coal-fired power, and the power system backup rate is exceedingly high;an orange warning is issued when the installed capacity of coal-fired power is abundant, and the power system backup rate is leaning towards being high;a green warning is issued when power supply and demand are basically balanced or if there is a shortage, and the power system backup rate is appropriate or relatively low。The calculation method, and the reference for power system backup rates for each province, autonomous region, and directly-controlled municipality can be seen in Annex 3 and 4
4. Binding resource constraints indicators are based on the emissions of air pollutants, water resources, total volume of coal consumption, and other related resource constraints of each province, autonomous region, and directly-controlled municipality. These are divided into two levels: red and green。If the air pollution is serious, the amount of water resources is insufficient, the total coal consumption needs to be controlled, or there are other restrictions on resources for coal power planning and construction, the resource constraint indicator results in a red warning;the rest is green。For the resource constraints situation in each province, autonomous region, and directly-controlled municipality, see annex 5。
V. To actively and steadily do a good job in dissolving the overcapacity of coal-fired power generation in 2018, and in accordance with the principle of appropriate strictness, guide the approval and construction of coal-fired power projects across the country。
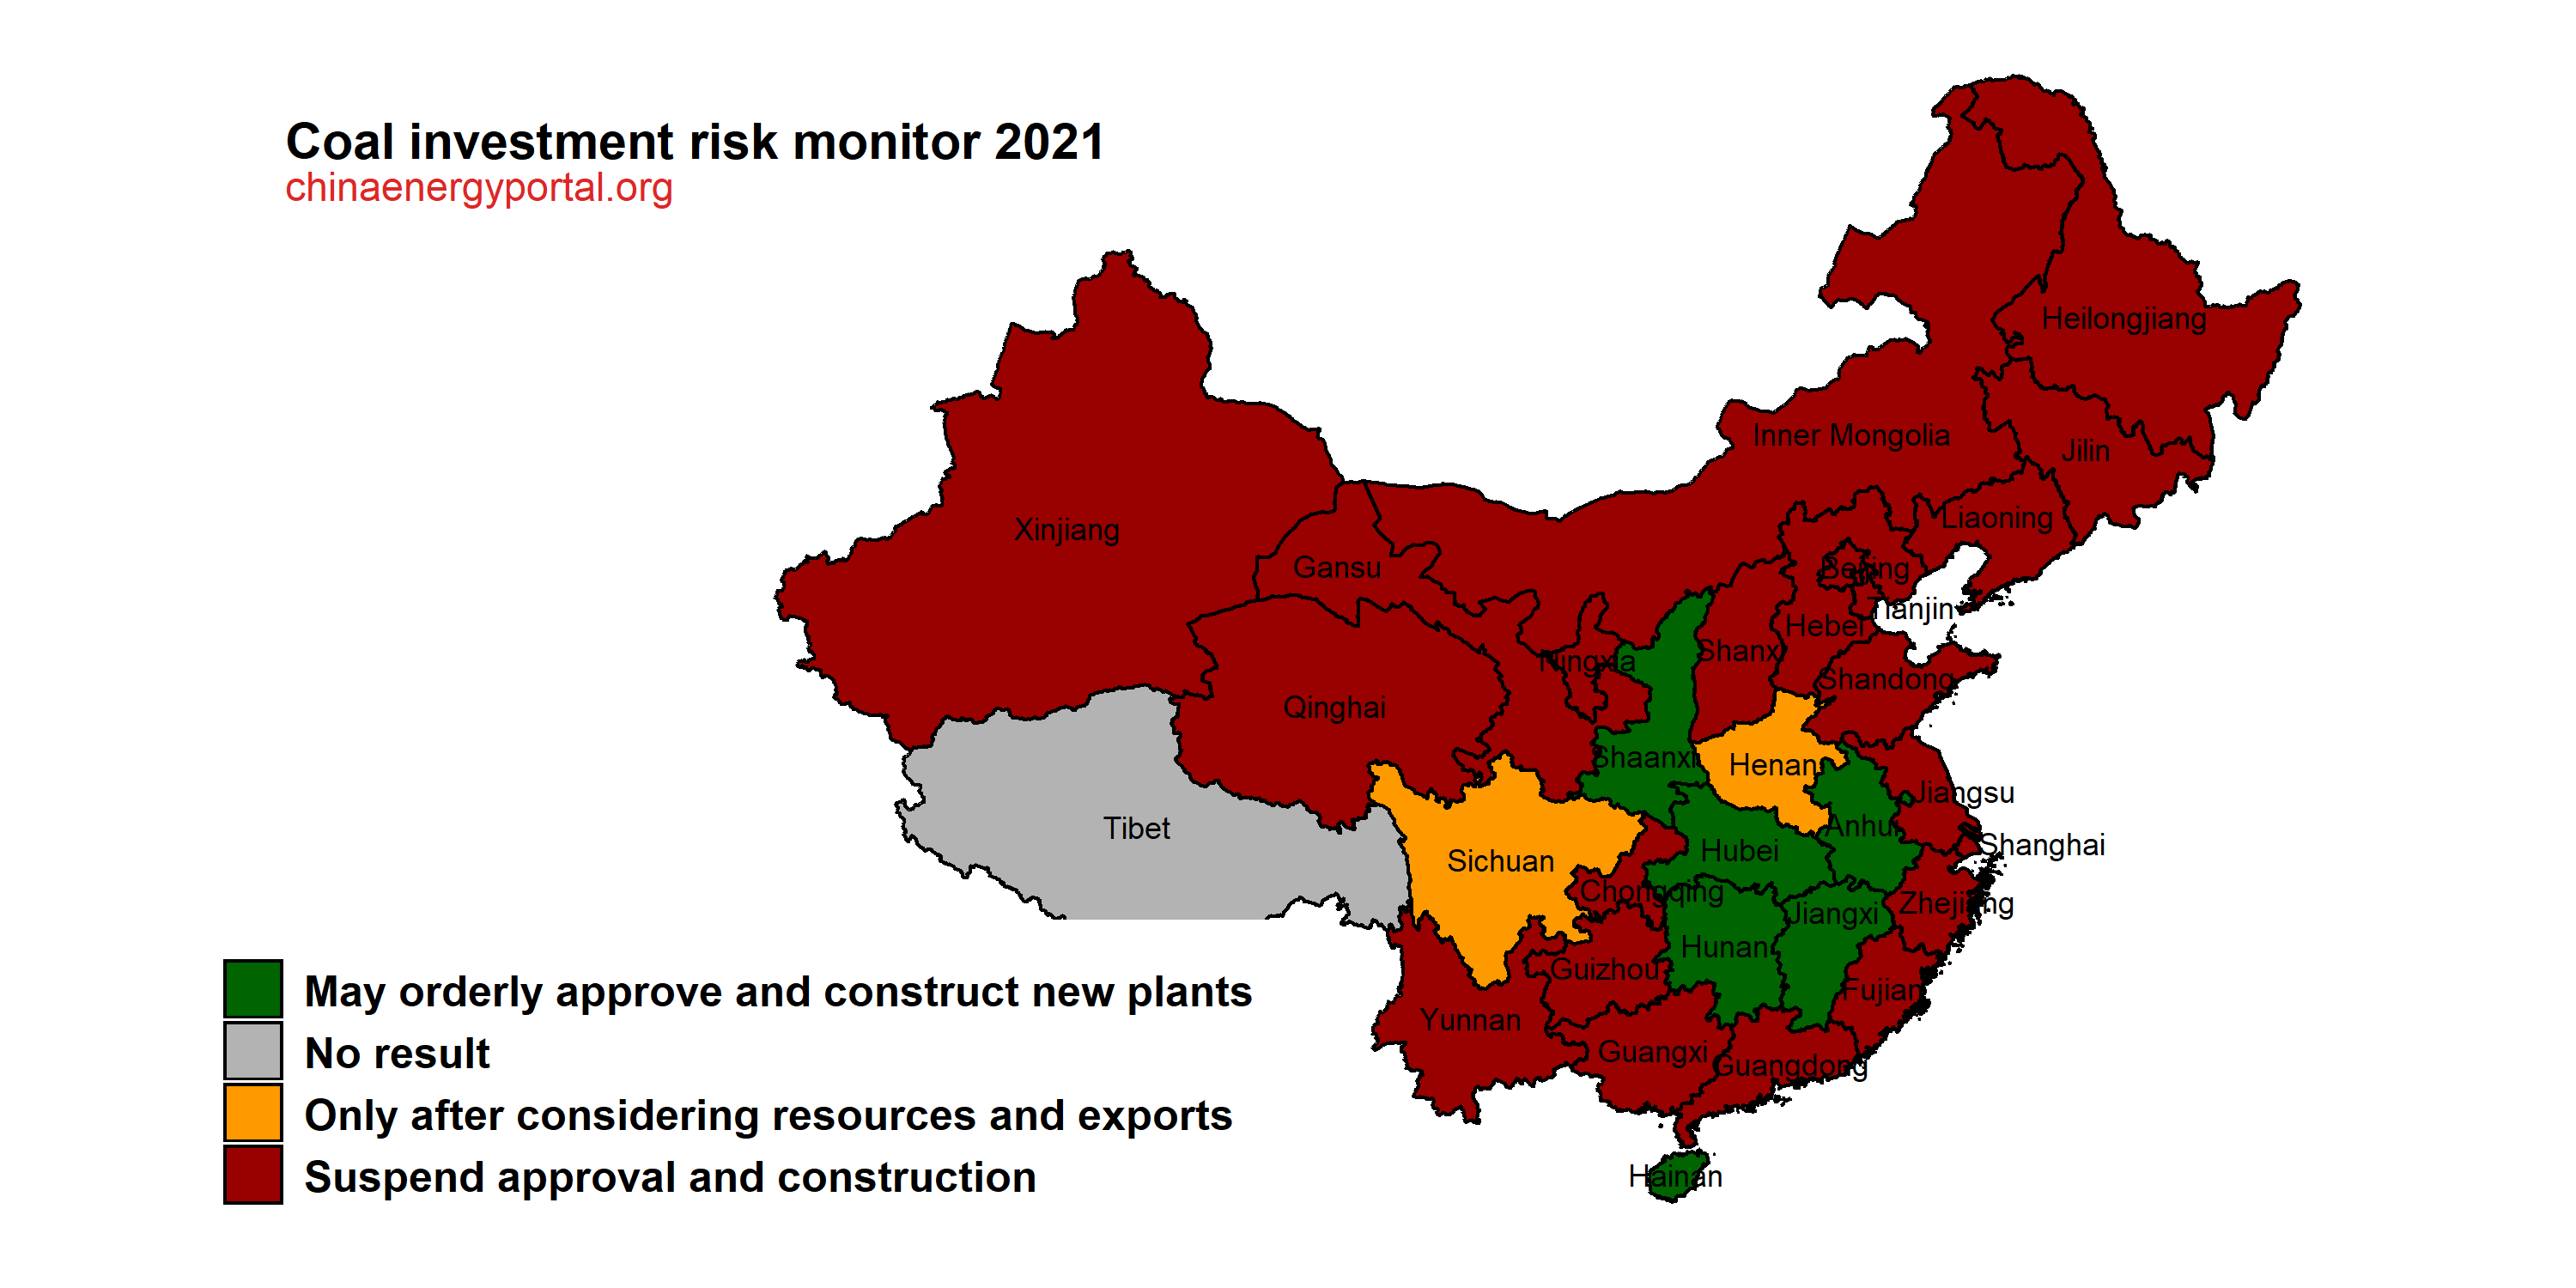
(1) Provinces with red and orange early warning indicators for installed capacity redundancy, shall temporarily suspend approval and new construction of coal-fired power generation projects (including auto-consumer coal-fired power generation units, same below), and under the guidance of the central government, reasonably schedule the timing of coming into operation of coal-fired power generation projects that are under construction。
(2) Provinces with green early warning indicators for installed capacity redundancy and resource constraints, shall fully consider the inter-provincial (regional) electricity exchange and other factors, and under the guidance of the central government, in an orderly manner approve and construct coal-fired power projects。
(3) Provinces with green early warning indicator for installed capacity redundancy and a red early warning indicator for resource constraints, shall fully consider the inter-provincial (district) electricity exchange and other factors, and under the guidance of the central government, implement requirements from relevant national policies on land and resources, environmental protection, water conservancy, etc., and comprehensively research issues related to the planning and construction of coal power projects
6. In the event of relatively large changes to coal prices, electricity prices or other key conditions, or of introduction of major policies, the early warning results will be updated and published in a supplementary release。Notice is hereby given。
Annex:
1. Calculation method for expected return on investment for coal-fired power projects
2. 2021 Economics early warning indicator
3. Installed capacity situation for different provinces, autonomous regions, and directly-controlled municipalities
4. 2021 Installed capacity redundancy situation
5. 2021 Resource constraints situation
Annex 1
Calculation method for expected return on investment for coal-fired power generation projects
klr = [(P– Rca×Pca/106) Tv / CE– (kzj+r×kll+kcb)]/ (1-r)
In which, klr:Return on capital investment for coal-fired power project;
P:Coal-fired power project's electricity price (excluding tax) (in RMB/kWh);
CE:Dynamic investment per kilowatt (in RMB/kW);
Tv:Expected annual utilization hours (unit: hours);
kzj:Depreciation rate; using a 20 years depreciation period, use 5%;
r:Share of loans in total investment; generally 80% for power projects;
kll:Interest rate on the loans;
kcb:Operating cost rate; ratio of total annual operating costs versus total investment, including maintenance costs, wages, benefits and insurance for personnel, material costs, other costs, etc.。ForKcbtake 2.5% as a benchmark for preliminary calculation of the rate of return on investment for a typical coal-fired power project;Then, enter this preliminary rate of return on investment into the formula:Kcb = 0,0737 × preliminary rate of return on investment for the project + 0,0118. This is the recommended value for Kcb to be used in this specific project。
Rca:Coal consumption of the generation unit (in g/kWh);
Pca:Expected standard coal price (including tax), in RMB/ton. Determined by reference to China's coal price index the past three years (converted to standard coal eq. at 7,000 kcal/kg) and by weighting with 0.5, 0.3 and 0.2, respectively。
Annex 3
Provincial (autonomous region, city level) reference power system backup rates
| No. | Area | Reasonable backup rate | Green zone | Orange zone | Red zone | |
| 1 | Heilongjiang | 13% | ≤17% | 17-18% | >18% | |
| 2 | Jilin | 13% | ≤15% | 15-17% | ≥17% | |
| 3 | Liaoning | 13% | ≤15% | 15-16% | ≥16% | |
| 4 | Inner Mongolia | Inner Mongolia (East) | 15% | ≤21% | 21-22% | ≥22% |
| 5 | Inner Mongolia (West) | 15% | ≤17% | 17-23% | ≥23% | |
| 6 | Beijing | 15% | – | – | – | |
| 7 | Tianjin | 15% | ≤19% | 19-23% | ≥23% | |
| 8 | Hebei | 13% | ≤14% | 14-18% | ≥18% | |
| 9 | Shandong | 13% | ≤14% | 14-18% | ≥18% | |
| 10 | Shanxi | 13% | ≤15% | 15-19% | ≥19% | |
| 11 | Shaanxi | 13% | ≤15% | 15-19% | ≥19% | |
| 12 | Gansu | 13% | ≤16% | 16-20% | ≥20% | |
| 11 | Qinghai | 13% | ≤16% | 16-21% | ≥21% | |
| 14 | Ningxia | 15% | ≤19% | 19-22% | ≥22% | |
| 15 | Xinjiang | 15% | ≤17% | 17-23% | ≥23% | |
| 16 | Henan | 14% | ≤15% | 15-20% | ≥20% | |
| 17 | Hubei | 14% | ≤16% | 16-22% | ≥22% | |
| 18 | Hunan | 14% | ≤17% | 17-22% | ≥22% | |
| 19 | Jiangxi | 14% | ≤16% | 16-23% | ≥23% | |
| 20 | Sichuan | 14% | ≤15% | 15-19% | ≥19% | |
| 21 | Chongqing | 15% | ≤18% | 18-21% | ≥21% | |
| 22 | Tibet | – | – | – | – | |
| 23 | Shanghai | 15% | ≤17% | 17-18% | ≥18% | |
| 24 | Jiangsu | 12% | ≤13% | 13-19% | ≥19% | |
| 25 | Zhejiang | 12% | ≤13% | 13-18% | ≥18% | |
| 26 | Anhui | 12% | ≤14% | 14-18% | ≥18% | |
| 27 | Fujian | 12% | ≤14% | 14-19% | ≥19% | |
| 28 | Guangdong | 13% | ≤14% | 14-19% | ≥19% | |
| 29 | Guangxi | 13% | ≤15% | 15-20% | ≥20% | |
| 30 | Yunnan | 13% | ≤15% | 15-17% | ≥17% | |
| 31 | Guizhou | 13% | ≤15% | 15-19% | ≥19% | |
| 32 | Hainan | 20% | ≤25% | 25-31% | ≥31% | |
Note:Green zone:The actual power system backup rate is not higher than the reasonable backup rate, or does not exceed the reasonable backup rate by more than the equivalent of a single local large-scale coal-fired power generation unit;
Red zone:The actual power system backup rate exceeds the reasonable backup rate by the equivalent of more than the local demand growth in a single year; Orange zone:The actual power system backup rate is between the red and green zones
Annex 2,4,5 [Put into one table by China Energy Portal]
2021 Economics early warning indicator
2021 Installed capacity redundancy situation
2021 Resource constraint situation
| No. | Area | 2021 Economics early warning indicator | 2021 Installed capacity redundancy situation | 2021 Resource constraint situation | |
| 1 | Heilongjiang | Green | Red | Green | |
| 2 | Jilin | Green | Red | Green | |
| 3 | Liaoning | Green | Orange | Green | |
| 4 | Inner Mongolia | Inner Mongolia (East) | Green | Red | Green |
| 5 | Inner Mongolia (West) | Green | Red | Green | |
| 6 | Beijing | – | – | Red | |
| 7 | Tianjin | Red | Red | Red | |
| 8 | Hebei | Northern Hebei | Green | Red | Red |
| 9 | Southern Hebei | Green | Green | Red | |
| 10 | Shandong | Red | Red | Red | |
| 11 | Shanxi | Green | Red | Green | |
| 12 | Shaanxi | Green | Green | Green | |
| 11 | Gansu | Red | Red | Green | |
| 14 | Qinghai | Red | Red | Green | |
| 15 | Ningxia | Red | Red | Green | |
| 16 | Xinjiang | Green | Red | Green | |
| 17 | Henan | Green | Orange | Green | |
| 18 | Hubei | Orange | Green | Green | |
| 19 | Hunan | Green | Green | Green | |
| 20 | Jiangxi | Green | Green | Green | |
| 21 | Sichuan | Red | Orange | Green | |
| 22 | Chongqing | Orange | Red | Green | |
| 23 | Tibet | – | – | Green | |
| 24 | Shanghai | Green | Green | Red | |
| 25 | Jiangsu | Green | Green | Red | |
| 26 | Zhejiang | Green | Green | Red | |
| 27 | Anhui | Green | Green | Green | |
| 28 | Fujian | Orange | Red | Green | |
| 29 | Guangdong | Green | Orange | Red | |
| 30 | Guangxi | Red | Red | Green | |
| 31 | Yunnan | Red | Red | Green | |
| 32 | Guizhou | Green | Red | Green | |
| 33 | Hainan | Green | Green | Green | |
Table 6. Comparison between 2020 and 2021 early warning results for coal-fired power construction
[Added by China Energy Portal; for 2020 results and explanation of the method to determine the overall result, see the the document introducing the early warning mechanism and evaluation result for 2020 (link)]

| No. | Area | 2021 Economics early warning indicator | 2021 Installed capacity redundancy situation | 2021 Resource constraint situation | 2020 early warning result | 2021 early warning result | Change | |
| 1 | Heilongjiang | Green | Red | Green | Red | Red | No Change | |
| 2 | Jilin | Green | Red | Green | Red | Red | No Change | |
| 3 | Liaoning | Green | Orange | Green | Red | Red | No Change | |
| 4 | Inner Mongolia | Inner Mongolia (East) | Green | Red | Green | Red | Red | No Change |
| 5 | Inner Mongolia (West) | Green | Red | Green | Red | Red | No Change | |
| 6 | Beijing | – | – | Red | Red | Red | No Change | |
| 7 | Tianjin | Red | Red | Red | Red | Red | No Change | |
| 8 | Hebei | Northern Hebei | Green | Red | Red | Red | Red | No Change |
| 9 | Southern Hebei | Green | Green | Red | Red | Red | No Change | |
| 10 | Shandong | Red | Red | Red | Red | Red | No Change | |
| 11 | Shanxi | Green | Red | Green | Red | Red | No Change | |
| 12 | Shaanxi | Green | Green | Green | Red | Green | Improvement | |
| 11 | Gansu | Red | Red | Green | Red | Red | No Change | |
| 14 | Qinghai | Red | Red | Green | Red | Red | No Change | |
| 15 | Ningxia | Red | Red | Green | Red | Red | No Change | |
| 16 | Xinjiang | Green | Red | Green | Red | Red | No Change | |
| 17 | Henan | Green | Orange | Green | Orange | Orange | No Change | |
| 18 | Hubei | Orange | Green | Green | Orange | Green | Improvement | |
| 19 | Hunan | Green | Green | Green | Green | Green | No Change | |
| 20 | Jiangxi | Green | Green | Green | Orange | Green | Improvement | |
| 21 | Sichuan | Red | Orange | Green | Red | Orange | Improvement | |
| 22 | Chongqing | Orange | Red | Green | Red | Red | No Change | |
| 23 | Tibet | – | – | Green | – | – | No Change | |
| 24 | Shanghai | Green | Green | Red | Red | Red | No Change | |
| 25 | Jiangsu | Green | Green | Red | Red | Red | No Change | |
| 26 | Zhejiang | Green | Green | Red | Red | Red | No Change | |
| 27 | Anhui | Green | Green | Green | Orange | Green | Improvement | |
| 28 | Fujian | Orange | Red | Green | Red | Red | No Change | |
| 29 | Guangdong | Green | Orange | Red | Red | Red | No Change | |
| 30 | Guangxi | Red | Red | Green | Red | Red | No Change | |
| 31 | Yunnan | Red | Red | Green | Red | Red | No Change | |
| 32 | Guizhou | Green | Red | Green | Red | Red | No Change | |
| 33 | Hainan | Green | Green | Green | Green | Green | No Change | |


