
All translations on this site are unofficial and provided for reference purpose only.
To view translations, select English under Step 1 (at the right of the screen). Not every item is (fully) translated. If you’re still seeing Chinese, you can use machine translation, under Step 2, to make sense of the rest.
Want to help translate? Switch to English under Step 1, and check ‘edit translation’ (more explanation in the FAQ). Even if you translate just a few lines, this is still very much appreciated! Remember to log in if you would like to be credited for your effort. If you’re unsure where to start translating, please see the list of Most wanted translations.
2018 wind power installations and production by province
Original title: 2018年风电并网运行情况
Links: Source document (in Chinese) (link). Same statistics for (2017) (2016) (2015) 2014) (2013).
Newly installed capacity 2018 (MW)
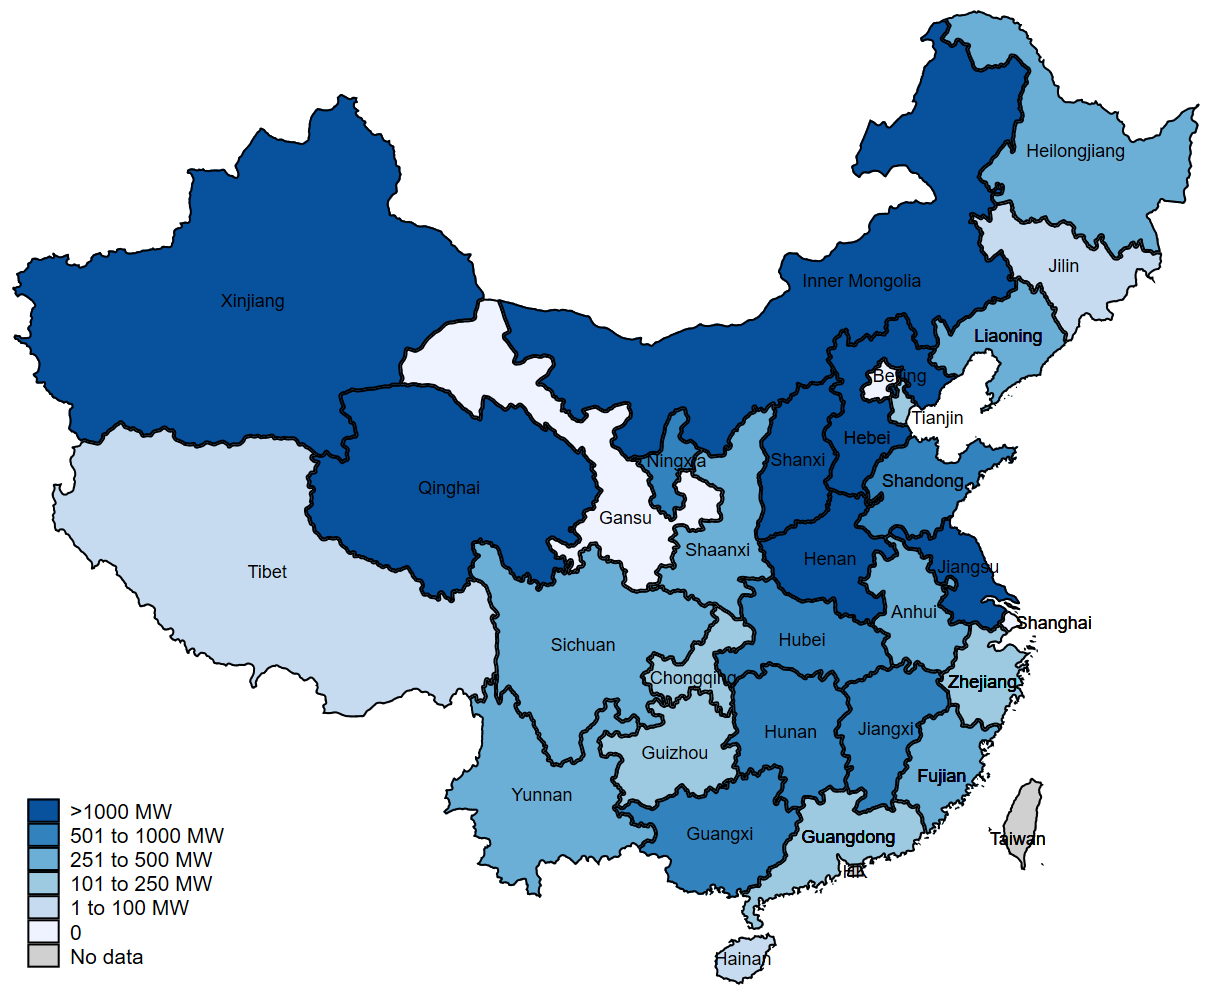
[graphs added by China Energy Portal]
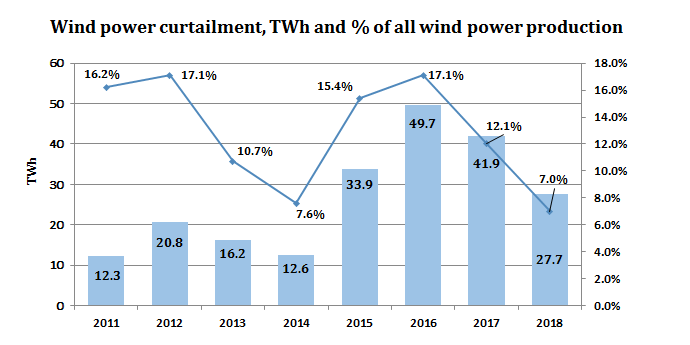
据行业统计,2018年,新增并网风电装机2059万千瓦,累计并网装机容量达到1.84亿千瓦,占全部发电装机容量的9.7%。2018年风电发电量3660亿千瓦时,占全部发电量的5.2%,比2017年提高0.4个百分点。2018年全国风电平均利用小时数2095小时,同比增加147小时;全年弃风电量277亿千瓦时,同比减少142亿千瓦时,平均弃风率7%,同比下降5个百分点,弃风限电状况明显缓解。
2018年,全国风电平均利用小时数较高的地区是云南(2654小时)、福建(2587小时)、上海(2489小时)和四川(2333小时)。
2018年,弃风率超过8%的地区是新疆(弃风率23%、弃风电量107亿千瓦时),甘肃(弃风率19%、弃风电量54亿千瓦时),内蒙古(弃风率10%、弃风电量72亿千瓦时)。三省(区)弃风电量合计233亿千瓦时,占全国弃风电量的84%。
2018年风电并网运行统计数据
| 省(区、市) | 新增并网容量 (MW) | 累计并网容量 (MW) | 发电量 (GWh) | 弃风电量 (GWh) | 弃风率 | 利用小时数 | 各省(区、市)承诺的2018年弃风率控制目标 |
| 合 计 | 20,590 | 184,260 | 366,000 | 27,700 | 7.0% | 2095 | |
| 北 京 | 0 | 190 | 300 | 1866 | 0 | ||
| 天 津 | 230 | 520 | 800 | 1830 | 0 | ||
| 河 北 | 2,100 | 13,910 | 28,300 | 1,550 | 5.2% | 2276 | 6.7%(冀北新能源平均) |
| 山 西 | 1,710 | 10,430 | 21,200 | 240 | 1.1% | 2196 | 4.2%(新能源平均) |
| 内蒙古 | 1,990 | 28,690 | 63,200 | 7,240 | 10.3% | 2204 | 12% |
| 辽 宁 | 500 | 7,610 | 16,500 | 160 | 1.0% | 2265 | 8% |
| 吉 林 | 90 | 5,140 | 10,500 | 770 | 6.8% | 2057 | — |
| 黑龙江 | 280 | 5,980 | 12,500 | 580 | 4.4% | 2144 | — |
| 上 海 | 0 | 710 | 1,800 | 2489 | 0 | ||
| 江 苏 | 2,090 | 8,650 | 17,300 | 2216 | 0 | ||
| 浙 江 | 150 | 1,480 | 3,100 | 2173 | 0 | ||
| 安 徽 | 290 | 2,460 | 5,000 | 2150 | 保10%争0% | ||
| 福 建 | 480 | 3,000 | 7,200 | 2587 | 0 | ||
| 江 西 | 560 | 2,250 | 4,100 | 1940 | 0 | ||
| 山 东 | 850 | 11,460 | 21,400 | 300 | 1.4% | 1971 | 2%左右 |
| 河 南 | 2,350 | 4,680 | 5,700 | 1746 | 0 | ||
| 湖 北 | 780 | 3,310 | 6,400 | 2159 | 确保10%争取0% | ||
| 湖 南 | 850 | 3,480 | 6,000 | 2054 | 4%(新能源平均) | ||
| 广 东 | 220 | 3,570 | 6,300 | 1770 | 0 | ||
| 广 西 | 580 | 2,080 | 4,200 | 2294 | 0 | ||
| 海 南 | 30 | 340 | 500 | 1524 | — | ||
| 重 庆 | 170 | 500 | 800 | 1968 | 0 | ||
| 四 川 | 430 | 2,530 | 5,500 | 2333 | 0 | ||
| 贵 州 | 170 | 3,860 | 6,800 | 80 | 1.1% | 1821 | 3% |
| 云 南 | 380 | 8,570 | 22,000 | 2654 | 确保10%争取0% | ||
| 西 藏 | 2 | 10 | 10 | 1863 | — | ||
| 陕 西 | 420 | 4,050 | 7,200 | 160 | 2.2% | 1959 | 弃电率下降1.8%,控制在2.2% |
| 甘 肃 | 0 | 12,820 | 23,000 | 5,400 | 19.0% | 1772 | 23% |
| 青 海 | 1,050 | 2,670 | 3,800 | 60 | 1.6% | 1524 | 0 |
| 宁 夏 | 690 | 10,110 | 18,700 | 440 | 2.3% | 1888 | — |
| 新 疆 | 1,150 | 19,210 | 35,900 | 10,690 | 22.9% | 1951 | 26% |
[newly added installations added by China Energy Portal, based on same stats for 2017]
备注: 1.容量单位:MW;电量单位:GWH;
2.并网容量、发电量、利用小时数来源于中电联;
3.弃风电量、弃风率来源于国家可再生能源中心、相关电网企业。数据为空白的表示不存在弃风现象。
4.各省承诺的全年弃风率控制目标为各省(区、市)在落实《解决弃水弃风弃光问题实施方案》工作方案中承诺的2018年全年弃风率控制目标,“–”表示工作方案中未提出弃风控制目标。


