All translations on this site are unofficial and provided for reference purpose only.
To view translations, select English under Step 1 (at the right of the screen). Not every item is (fully) translated. If you’re still seeing Chinese, you can use machine translation, under Step 2, to make sense of the rest.
Want to help translate? Switch to English under Step 1, and check ‘edit translation’ (more explanation in the FAQ). Even if you translate just a few lines, this is still very much appreciated! Remember to log in if you would like to be credited for your effort. If you’re unsure where to start translating, please see the list of Most wanted translations.
2012 & 2013 distributed and utility PV installations by province
Original title: 2013年光伏发电统计数据
Links: Original CN (link). Same statistics for: (2018) (2017) (2016) (2015) (2014) (2013) (2012).
In 2013, supported by the "Opinions on promoting the healthy development of the PV industry" of the State Council and a series of supporting policies, PV power generation has rapidly developed。By the end of 2013, the national total installed capacity of grid-connected PV 19.42 GW, of which 16.32 GW of PV power plants, and 3.1 GW distributed PV, with an annual electricity production of 9 TWh。In 2013, newly installed PV capacity was 12.92 GW, of which 12.12 GW of PV power plants, and 800 MW of distributed PV。
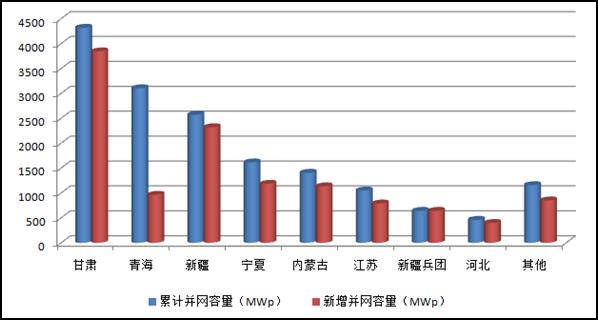
utility scale PV plants。By the end of 2013, there was a total of 741 grid-connected large-scale PV power generation projects in 22 key provinces (autonomous regions, municipalities), mainly in Northwest China。The top three provinces in terms of cumulative installed capacity are Gansu, Qinghai and Xinjiang, with 4.32 GW, 3.1 GW, and 2.57 GW. These three provinces (regions) accounted for more than 60% of the national total PV power plant capacity。For installed capacity of PV power plants by province (autonomous region, municipality), see Table 1。
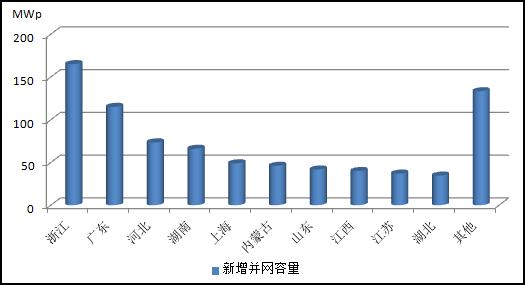
Distributed PV。Mainly in the central and eastern regions, where the electricity load is relatively concentrated. East China and North China had grid-connected capacities of 1.45 GW and 490 MW, accounting for 60% of the national capacity of distributed PV。The top three provinces in terms of cumulative installled capacity are Zhejiang, Guangdong and Hebei, where capacity reached 160 MW, 110 MW and 70 MW, together accounting for over 40% of total national installed capacity of distributed PV。For installed capacity of distributed PV by province (autonomous region, municipality), see Table 2。
Table 1. Statistics on grid-connected PV power plants by province (autonomous region, municipality)
| No. | Province | Cumulative, year-end 2012 | Newly added 2013 | Cumulative, year-end 2013 | ||||||
| Grid-connected capacity (MWp) | No. of power plants | Market share | Grid-connected capacity (MWp) | No. of power plants | Market share | Grid-connected capacity (MWp) | No. of power plants | Market share | ||
| 1 | Gansu | 475 | 46 | 11.3% | 3842 | 93 | 31.7% | 4317 | 139 | 26.5% |
| 2 | Qinghai | 2140 | 99 | 51.0% | 963 | 20 | 7.9% | 3103 | 119 | 19.0% |
| 3 | Xinjiang | 250 | 11 | 6.0% | 2320 | 110 | 19.1% | 2570 | 121 | 15.8% |
| 4 | Ningxia | 431 | 31 | 10.3% | 1183 | 47 | 9.8% | 1614 | 78 | 9.9% |
| 5 | Inner Mongolia | 272 | 18 | 6.5% | 1133 | 38 | 9.3% | 1405 | 56 | 8.6% |
| 6 | Jiangsu | 260 | 21 | 6.2% | 789 | 90 | 6.5% | 1049 | 111 | 6.4% |
| 7 | XPCC | 0 | 0 | 0.0% | 641 | 24 | 5.3% | 641 | 27 | 3.9% |
| 8 | Hebei | 63 | 3 | 1.5% | 398 | 11 | 3.3% | 461 | 14 | 2.8% |
| 9 | Shanxi | 5 | 2 | 0.1% | 270 | 8 | 2.2% | 275 | 10 | 1.7% |
| 10 | Shaanxi | 60 | 5 | 1.4% | 210 | 5 | 1.7% | 270 | 10 | 1.7% |
| 11 | Yunnan | 20 | 3 | 0.5% | 160 | 6 | 1.3% | 180 | 9 | 1.1% |
| 12 | Shandong | 79 | 8 | 1.9% | 33 | 5 | 0.3% | 112 | 11 | 0.7% |
| 11 | Tibet | 100 | 9 | 2.4% | 10 | 1 | 0.1% | 110 | 10 | 0.7% |
| 14 | Hainan | 10 | 1 | 0.2% | 73 | 2 | 0.6% | 83 | 3 | 0.5% |
| 15 | Liaoning | 10 | 1 | 0.2% | 20 | 2 | 0.2% | 30 | 3 | 0.2% |
| 16 | Sichuan | 0 | 0 | 0.0% | 30 | 2 | 0.2% | 30 | 2 | 0.2% |
| 17 | Jiangxi | 5 | 1 | 0.1% | 20 | 1 | 0.2% | 25 | 2 | 0.2% |
| 18 | Shanghai | 16 | 10 | 0.4% | 0.3 | 0 | 0.0% | 16 | 10 | 0.1% |
| 19 | Jilin | 0 | 0 | 0.0% | 10 | 1 | 0.1% | 10 | 1 | 0.1% |
| 20 | Heilongjiang | 0 | 0 | 0.0% | 10 | 1 | 0.1% | 10 | 1 | 0.1% |
| 21 | Hunan | 0 | 0 | 0.0% | 3 | 1 | 0.0% | 3 | 1 | 0.0% |
| 22 | Anhui | 2 | 1 | 0.0% | 0 | 0 | 0.0% | 2 | 1 | 0.0% |
| Total | 4198 | 273 | 100.0% | 12119 | 468 | 100.0% | 16317 | 741 | 100.0% | |
Figure 1. Grid-connected PV power plant status in key provinces (regions), year-end 2013

Table 2. Statistics on distributed PV installations by province (autonomous region, municipality)
| No. | Province | Cumulative, year-end 2012 | Newly added 2013 | Cumulative, year-end 2013 | ||
| Grid-connected capacity (MWp) | Grid-connected capacity (MWp) | Market share | Grid-connected capacity (MWp) | Market share | ||
| 1 | Zhejiang | 260 | 165 | 20.6% | 425 | 13.7% |
| 2 | Hunan | 234 | 66 | 8.2% | 300 | 9.7% |
| 3 | Guangdong | 185 | 115 | 14.4% | 300 | 9.7% |
| 4 | Jiangsu | 2018 | 37 | 4.6% | 255 | 8.2% |
| 5 | Shandong | 163 | 42 | 5.2% | 205 | 6.6% |
| 6 | Shanghai | 140 | 49 | 6.1% | 189 | 6.1% |
| 7 | Hebei | 112 | 74 | 9.2% | 186 | 6.0% |
| 8 | Jiangxi | 118 | 40 | 5.0% | 158 | 5.1% |
| 9 | Inner Mongolia | 107 | 46 | 5.7% | 153 | 4.9% |
| 10 | Anhui | 124 | 26 | 3.2% | 150 | 4.8% |
| 11 | Hubei | 65 | 35 | 4.4% | 100 | 3.2% |
| 12 | Shaanxi | 61 | 29 | 3.6% | 90 | 2.9% |
| 11 | Beijing | 85 | 2 | 0.2% | 87 | 2.8% |
| 14 | Hainan | 73 | 2 | 0.2% | 75 | 2.4% |
| 15 | Fujian | 62 | 11 | 1.4% | 73 | 2.4% |
| 16 | Liaoning | 39 | 32 | 4.0% | 71 | 2.3% |
| 17 | Henan | 64 | 2 | 0.2% | 66 | 2.1% |
| 18 | Guangxi | 53 | 0.6 | 0.1% | 53 | 1.7% |
| 19 | Tianjin | 37 | 2 | 0.2% | 39 | 1.3% |
| 20 | Xinjiang | 26 | 7 | 0.9% | 33 | 1.1% |
| 21 | Shanxi | 20 | 11 | 1.4% | 31 | 1.0% |
| 22 | Heilongjiang | 27 | 0.1 | 0.0% | 27 | 0.9% |
| 23 | Yunnan | 11 | 3 | 0.4% | 14 | 0.5% |
| 24 | Gansu | 11 | 0.3 | 0.0% | 11 | 0.4% |
| 25 | Sichuan | 5 | 4 | 0.5% | 9 | 0.3% |
| 26 | Tibet | 0 | 1 | 0.1% | 1 | 0.0% |
| 27 | Qinghai | 0 | 0.6 | 0.1% | 0.6 | 0.0% |
| 28 | Chongqing | 0 | 0.02 | 0.0% | 0.02 | 0.0% |
| Total | 2300 | 801 | 100.0% | 3101 | 100.0% | |
Note: statistics for Tibet, Jilin and other provinces are incomplete
Figure 2. Distributed PV status in key provinces (regions), year-end 2013

