
All translations on this site are unofficial and provided for reference purpose only.
To view translations, select English under Step 1 (at the right of the screen). Not every item is (fully) translated. If you’re still seeing Chinese, you can use machine translation, under Step 2, to make sense of the rest.
Want to help translate? Switch to English under Step 1, and check ‘edit translation’ (more explanation in the FAQ). Even if you translate just a few lines, this is still very much appreciated! Remember to log in if you would like to be credited for your effort. If you’re unsure where to start translating, please see the list of Most wanted translations.
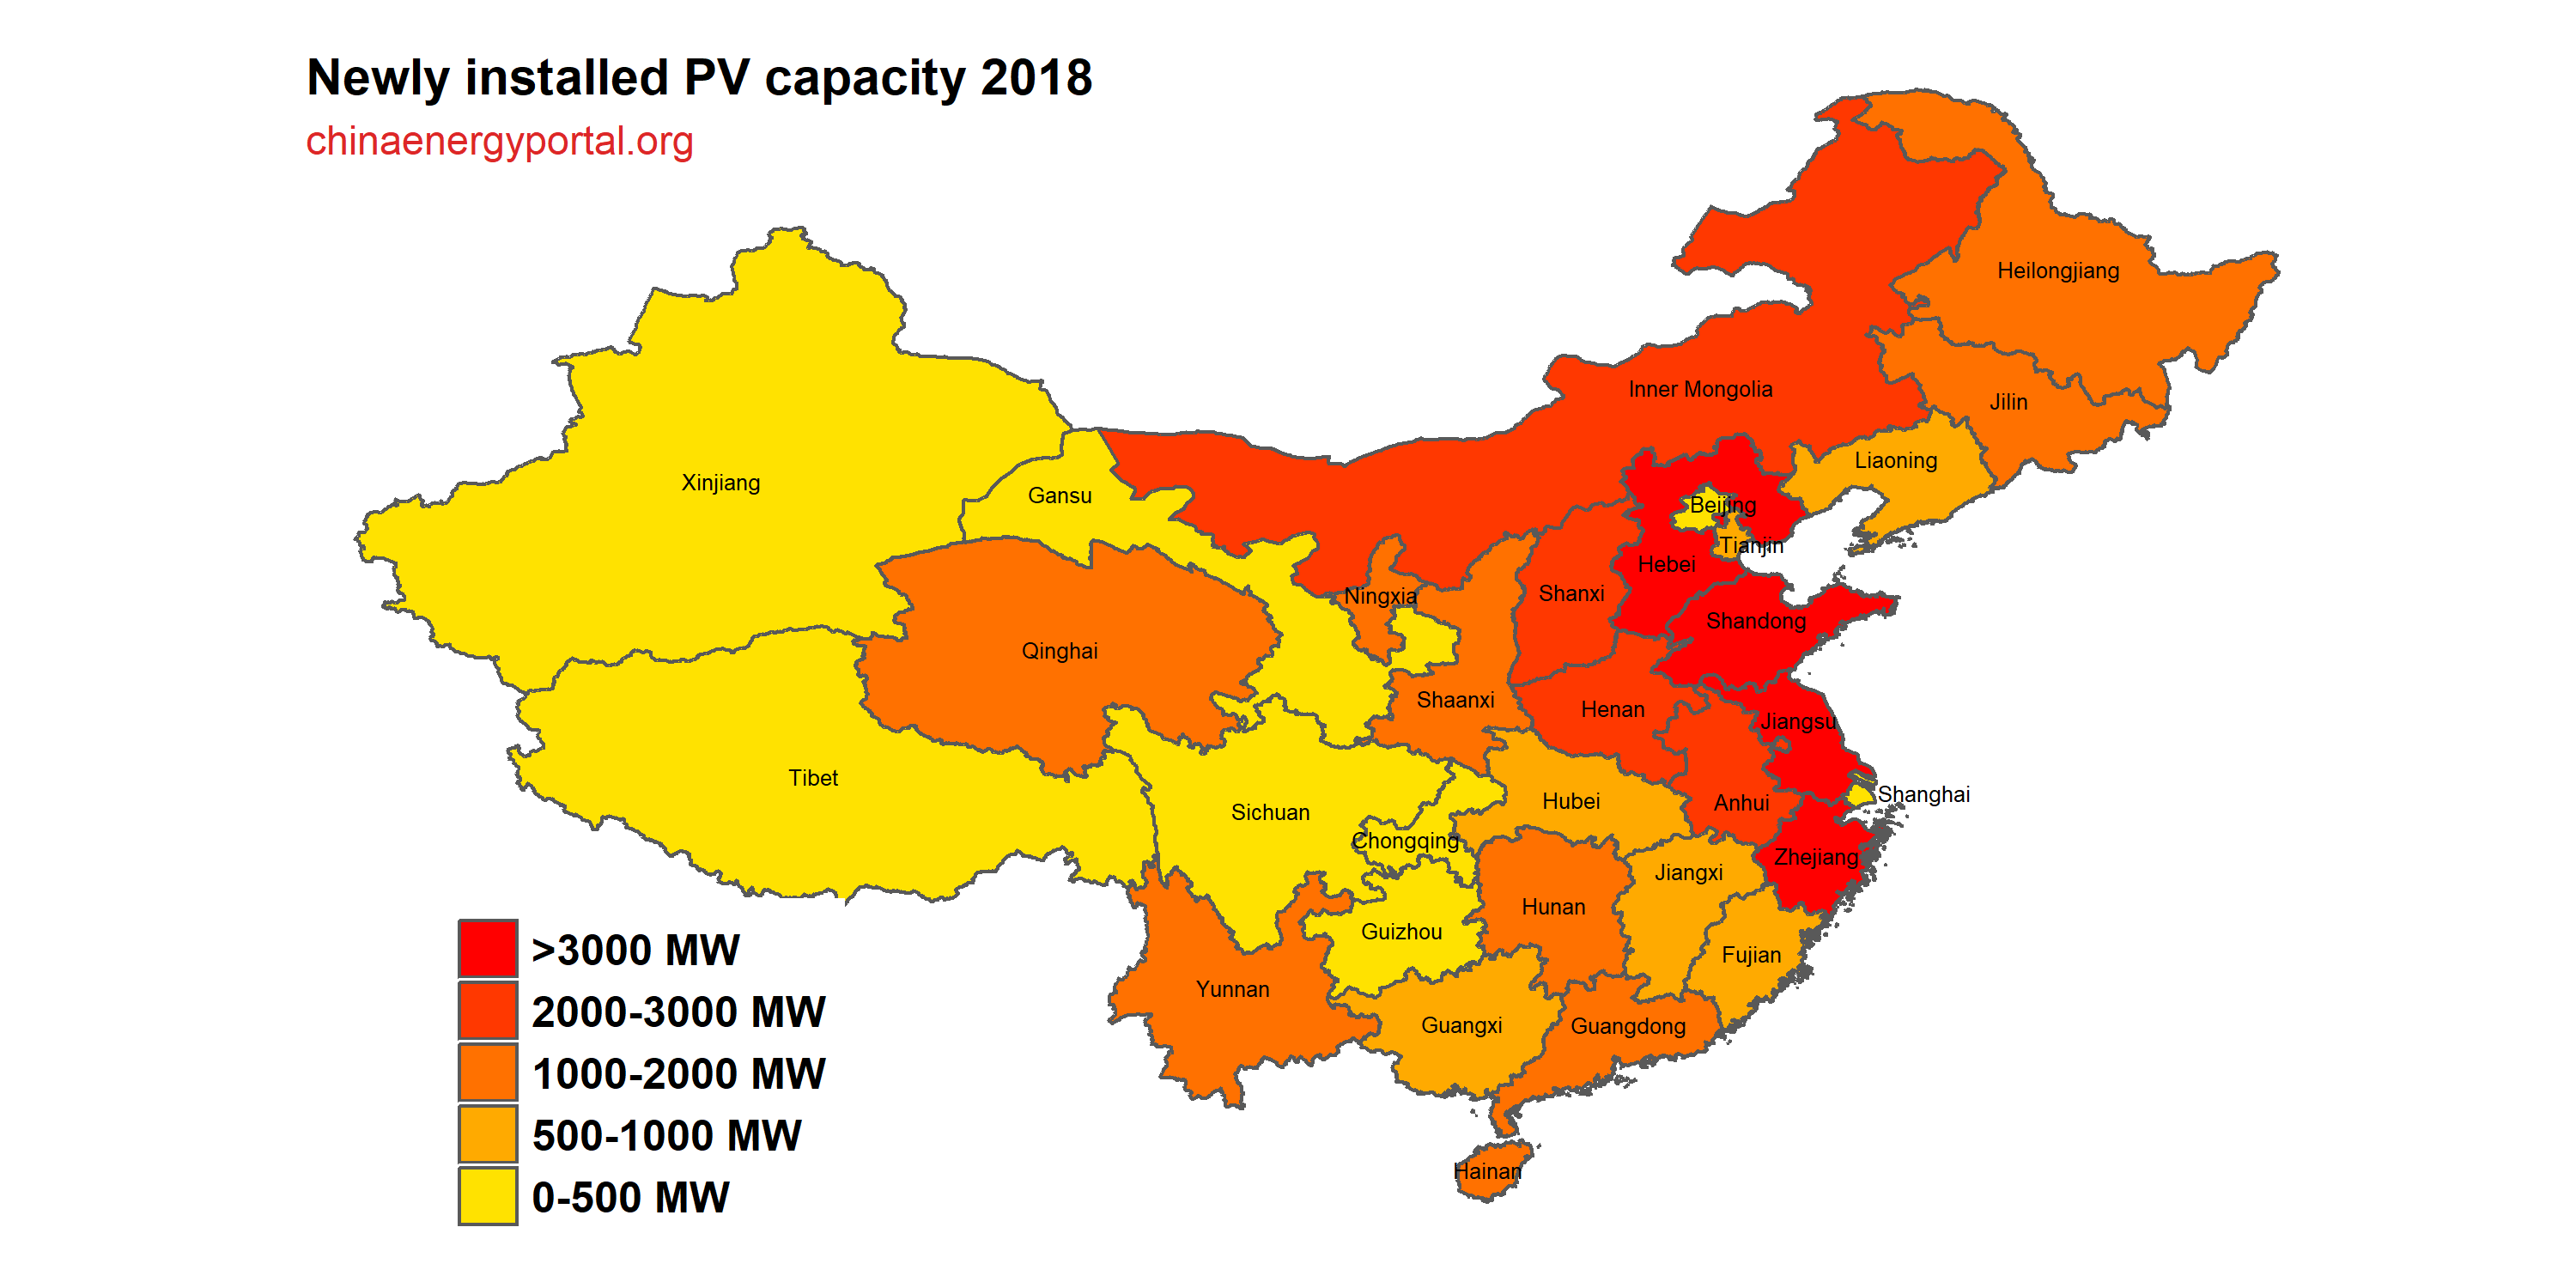
2018 PV installations utility and distributed by province
Original title: 2018年光伏发电统计信息
Links: Source document (in Chinese) (link). Same statistics for: (2018) (2017) (2016) (2015) (2014) (2013) (2012).
2018 National PV statistics
By the end of 2018, nationwide installed capacity of PV reached 174 GW, an increase of 34%. Newly installed capacity, at 44.26 GW, were down from last year。Of this, 123.84 GW was utility scale PV plants, an increase of 23%. Newly installed capacity of utility scale PV plants, at 23.3 GW, was down from last year;Installed capacity of distributed PV reached 50.61 GW, an increase of 71%. Newly installed capacity of distributed PV was 20.96 GW, a little above last year's newly added capacity。
In 2018, total PV generation was 177.5 TWh, an increase of 50% on last year;average productivity was 1,115 full-load hours, an increase of 37 hours on last year。Areas with relatively high PV productivity were the Western part of Inner Mongolia (1,617 full-load hours), the Eastern part of Inner Mongolia (1,523 hours), Qinghai (1,460 hours), and Sichuan (1,439 hours)。
In 2018, nationwide PV curtailment was 5.49 TWh, down 1.80 TWh compared with last year;curtailment rates were 3%, down 2.8 percentage points on last year, achieving a "double reduction" of curtailment volumes and curtailment rates。PV curtailment occurred mainly in Xinjiang and Gansu, with 2.14 TWh of PV curtailment in Xinjiang (excluding XPCC), or a curtailment rate of 16%, down 6 percentage points on last year;PV curtailment in Gansu was 1.03 TWh, or a curtailment rate of 10%, down 10 percentage points on last year。
For 2018 PV statistics by province (autonomous region, municipality) see the attached table。
Annex:
2018 National PV statistics
| Province (autonomous region, municipality) | Cumulative installed capacity (MW) | Newly installed capacity (MW) | ||
| Of which:utility scale PV plants | Of which:utility scale PV plants | |||
| Total | 174,460 | 123,840 | 44,260 | 23,300 |
| Beijing | 400 | 50 | 150 | 0 |
| Tianjin | 1,280 | 970 | 600 | 440 |
| Hebei | 12,340 | 8,560 | 3,660 | 1,950 |
| Shanxi | 8,640 | 6,810 | 2,740 | 1,510 |
| Inner Mongolia | 9,450 | 9,120 | 2,020 | 1,710 |
| Liaoning | 3,020 | 2,190 | 790 | 340 |
| Jilin | 2,650 | 2,030 | 1,060 | 950 |
| Heilongjiang | 2,150 | 1,410 | 1,210 | 700 |
| Shanghai | 890 | 60 | 310 | 40 |
| Jiangsu | 13,320 | 7,920 | 4,250 | 2,080 |
| Zhejiang | 11,380 | 3,620 | 3,240 | 470 |
| Anhui | 11,180 | 6,770 | 2,300 | 1,120 |
| Fujian | 1,480 | 370 | 550 | 30 |
| Jiangxi | 5,360 | 2,940 | 870 | 170 |
| Shandong | 13,610 | 6,480 | 3,090 | 670 |
| Henan | 9,910 | 6,000 | 2,870 | 700 |
| Hubei | 5,100 | 3,350 | 970 | 320 |
| Hunan | 2,920 | 1,260 | 1,170 | 410 |
| Guangdong | 5,270 | 2,820 | 1,960 | 890 |
| Guangxi | 1,240 | 940 | 550 | 310 |
| Hainan | 1,360 | 1,230 | 1,030 | 960 |
| Chongqing | 430 | 390 | 300 | 280 |
| Sichuan | 1,810 | 1,670 | 460 | 410 |
| Guizhou | 1,780 | 1,680 | 410 | 330 |
| Yunnan | 3,430 | 3,310 | 1,090 | 1,030 |
| Tibet | 980 | 980 | 180 | 180 |
| Shaanxi | 7,160 | 6,130 | 1,920 | 1,380 |
| Gansu | 8,280 | 7,790 | 440 | 130 |
| Qinghai | 9,560 | 9,460 | 1,660 | 1,610 |
| Ningxia | 8,160 | 7,620 | 1,960 | 1,740 |
| Xinjiang | 9,530 | 9,520 | 450 | 440 |
| XPCC | 390 | 390 | 0 | 0 |
Note:1. The above statistics do not include Hong Kong, Macao and Taiwan;2. Data source:National Renewable Energy Center。


