
All translations on this site are unofficial and provided for reference purpose only.
To view translations, select English under Step 1 (at the right of the screen). Not every item is (fully) translated. If you’re still seeing Chinese, you can use machine translation, under Step 2, to make sense of the rest.
Want to help translate? Switch to English under Step 1, and check ‘edit translation’ (more explanation in the FAQ). Even if you translate just a few lines, this is still very much appreciated! Remember to log in if you would like to be credited for your effort. If you’re unsure where to start translating, please see the list of Most wanted translations.
2017 Q1&2 PV installations utility and distributed by province
Original title: 2017年上半年光伏发电建设运行信息简况
Links: Original source (in Chinese) (link) Same statistics for (2018 Q1&2) (2017 Q1&2) (2016 Q1&2) (2015 Q1&2).
In the first half of 2017, nationwide additions of PV power generation capacity were 24.4 GW, an increase of 9% on the same period last year, of which:PV power plant 17.29 GW, down 16% on the same period last year;Installations of distributed PV were 7.11 GW, 2.9 times as much as the same period last year。Newly added capacity of PV in June was 13.15 GW, an increase of 16 percent year-on-year, of which:PV power plants 10.07 GW, down 8% year-on-year;Distributed PV 3.08 GW, an eight-fold increase year-on-year。By the end of June, nationwide PV power generation capacity reached 101.82 GW, of which:PV power plants 84.39 GW, distributed PV 17.43 GW。
In the first half of 2017, PV power generation was 51.8 TWh, an increase of 75% on the same period last year。Nationwide curtailment of PV was 3.7 TWh, meaning PV curtailment rates fell by 4.5 percentage points. PV curtailment occurred mostly in Xinjiang and Gansu, of which:Xinjiang (including XPCC) had PV curtailment of 1.7 TWh, or a curtailment rate of 26%, down 6 percentage points on the same period last year;Gansu had PV curtailment of 0.97 TWh, or a curtailment rate of 22%, down almost 10 percentage points on the same period last year。
From a geographic perspective, new installations saw a more obvious shift from the Northwestern to Eastern regions。Newly installed capacity in East China was 8.25 GW, 1.5 times as much as the same period last year, and accounting for 34% of newly added capacity nationwide. This includes Zhejiang, Jiangsu and Anhui provinces, which each had newly installed capacity exceeding over 2 GW。Newly installed capacity in Central China was 4.23 GW, an increase of 37 percent on the same period last year, accounting for 17.3% of new installations nationwide。Newly installed capacity in the Northwest was 4.16 GW, down 50% on the same period last year。
The development of distributed PV generation capacity continues to accelerate. This was mainly concentrated in Zhejiang, Shandong and Anhui provinces, where newly installed capacity exceeded 1 GW, more than a twofold increase on the same period last year. Together, these three provinces accounted for 54.2% of nationwide newly added capacity of distributed PV。
For 2017 Q1&2 statistics on PV construction and operation by province (autonomous region, municipality), see the annex。
Annex:
2017 Q1&2 PV construction and operation statistics
| Province (autonomous region, municipality) | Cumulative installed capacity (MW) | Newly installed capacity (MW) | ||||
| utility scale PV plants | Distributed | utility scale PV plants | Distributed | |||
| Total | 101,820 | 84,390 | 17,430 | 24,400 | 17,290 | 7,110 |
| Beijing | 240 | 50 | 190 | 0 | 0 | 0 |
| Tianjin | 600 | 480 | 120 | 0 | 0 | 0 |
| Hebei | 6,020 | 5,120 | 900 | 1,590 | 1,080 | 510 |
| Shanxi | 3,700 | 3,360 | 340 | 730 | 520 | 210 |
| Inner Mongolia | 6,960 | 6,950 | 10 | 600 | 590 | 10 |
| Liaoning | 1,280 | 1,040 | 240 | 760 | 680 | 80 |
| Jilin | 1,160 | 960 | 200 | 600 | 450 | 150 |
| Heilongjiang | 650 | 590 | 60 | 490 | 480 | 10 |
| Shanghai | 470 | 20 | 450 | 110 | 0 | 110 |
| Jiangsu | 7,870 | 5,590 | 2,280 | 2,420 | 1,860 | 560 |
| Zhejiang | 5,990 | 2,660 | 3,330 | 2,600 | 1,350 | 1,250 |
| Anhui | 6,360 | 4,200 | 2,160 | 2,910 | 1,530 | 1,380 |
| Fujian | 480 | 230 | 250 | 210 | 120 | 90 |
| Jiangxi | 3,250 | 2,350 | 900 | 970 | 630 | 340 |
| Shandong | 6,090 | 3,670 | 2,420 | 1,540 | 310 | 1,230 |
| Henan | 4,650 | 3,870 | 780 | 1,800 | 1,390 | 410 |
| Hubei | 2,700 | 2,240 | 460 | 830 | 570 | 260 |
| Hunan | 890 | 450 | 440 | 600 | 450 | 150 |
| Guangdong | 2,570 | 1,520 | 1,050 | 1,010 | 840 | 170 |
| Guangxi | 410 | 310 | 100 | 230 | 220 | 10 |
| Hainan | 320 | 270 | 50 | -20 | 20 | -40 |
| Chongqing | 10 | 0 | 10 | 0 | 0 | 0 |
| Sichuan | 990 | 920 | 70 | 30 | 20 | 10 |
| Guizhou | 660 | 660 | 0 | 200 | 200 | 0 |
| Yunnan | 2,110 | 2,080 | 30 | 20 | 0 | 20 |
| Tibet | 570 | 570 | 0 | 250 | 250 | 0 |
| Shaanxi | 4,810 | 4,580 | 230 | 1,470 | 1,360 | 110 |
| Gansu | 7,660 | 7,550 | 110 | 800 | 760 | 40 |
| Qinghai | 7,190 | 7,170 | 20 | 370 | 350 | 20 |
| Ningxia | 6,110 | 5,880 | 230 | 850 | 830 | 20 |
| Xinjiang | 7,200 | 7,200 | 0 | 110 | 110 | 0 |
| XPCC | 1,850 | 1,850 | 0 | 320 | 320 | 0 |
Note:Hainan's statistics for Q1 2017 had an error of 40 MW. This has been subtracted in the corresponding data in this table, which means that the newly installed capacity total is less than the newly installed capacity of PV power plants。
2017 Q1&2 Newly added installations
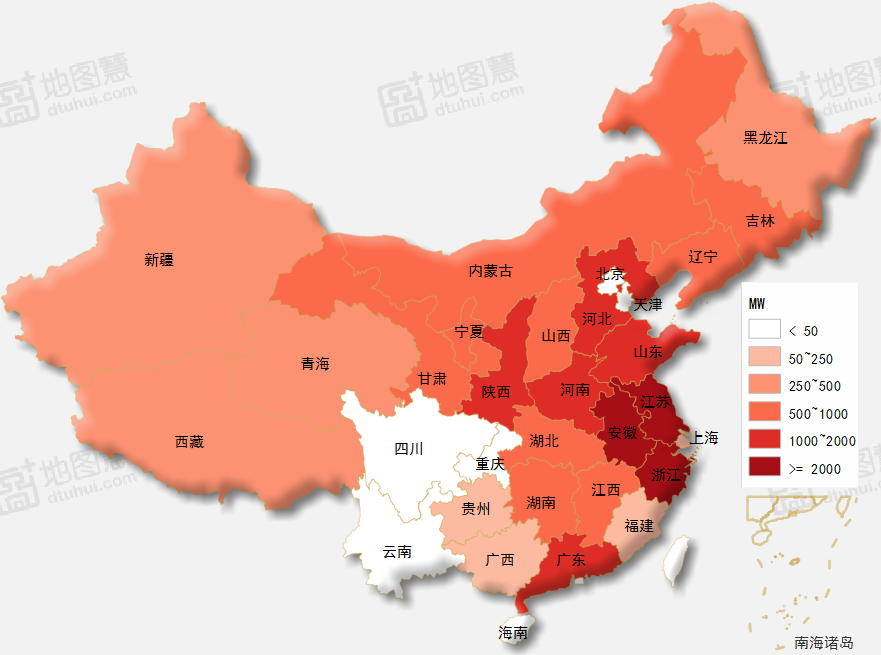
[map added by China Energy Portal, created on dituhui.com (link)]


