
All translations on this site are unofficial and provided for reference purpose only.
To view translations, select English under Step 1 (at the right of the screen). Not every item is (fully) translated. If you’re still seeing Chinese, you can use machine translation, under Step 2, to make sense of the rest.
Want to help translate? Switch to English under Step 1, and check ‘edit translation’ (more explanation in the FAQ). Even if you translate just a few lines, this is still very much appreciated! Remember to log in if you would like to be credited for your effort. If you’re unsure where to start translating, please see the list of Most wanted translations.
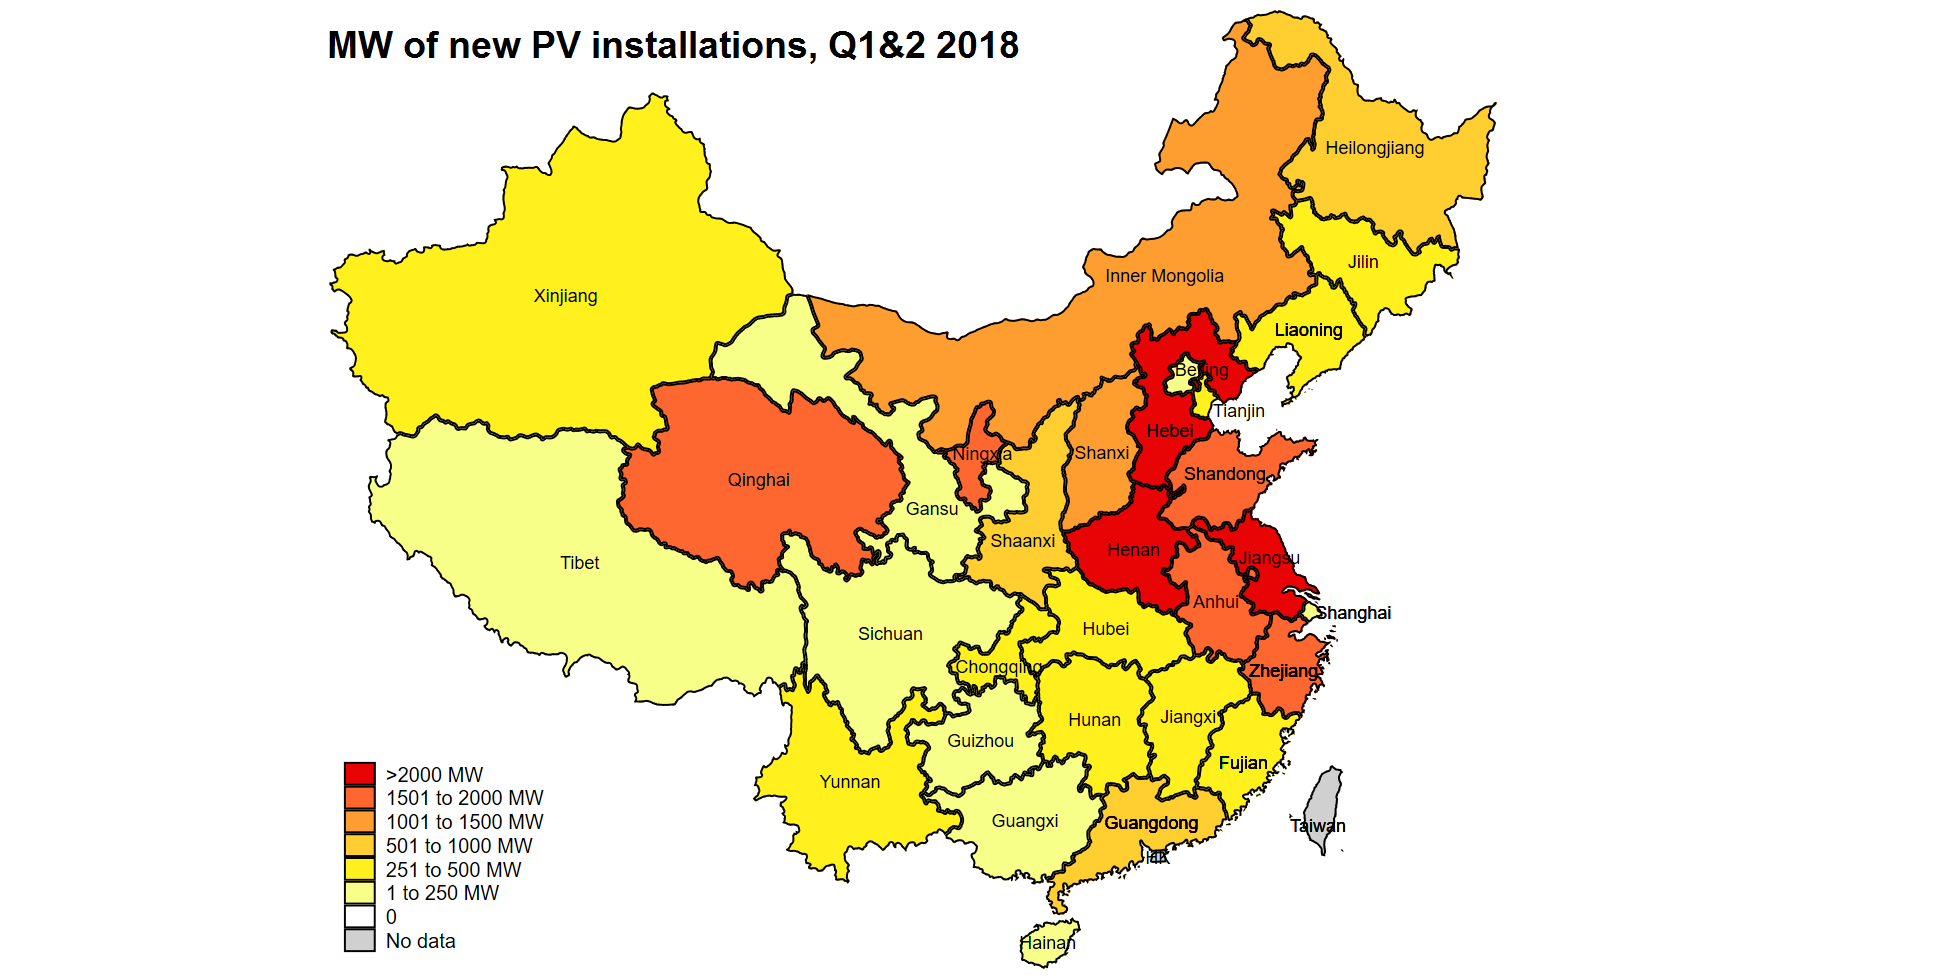
2018 Q1&2 PV installations utility and distributed by province
Original title: 2018年上半年光伏建设运行情况
Links: Source document (in Chinese) (link). Same statistics for (2018 Q1&2) (2017 Q1&2) (2016 Q1&2) (2015 Q1&2).
In H1 2018, newly installed PV capacity in China was 24,306 MW, essentially the same as in the same period last year. Of this, utility scale PV power plant installations were 12,062 MW, down 30% on the same period last year;installations of distributed PV were 12,244 MW, an increase of 72% YoY。
By the end of June 2018, nationwide PV generation capacity reached 154.51 GW, of which 112.6 GW of utility scale PV power plants, and 41.90 GW distributed PV。PV power generation in the first half of 2018 was 82.39 TWh, an increase of 59% YoY;the curtailment rate was 3.6%, down 3.2 percentage points YoY。curtailment occurred mainly in Xinjiang and Gansu. In Xinjiang (excluding XPCC) curtailment of PV was 1350 GWh, a curtailment rate of 20%, down 6.1 percentage points YoY;In Gansu curtailment of PV was 590 GWh, a curtailment rate of 11%, down 11 percentage points YoY。
Regarding the distribution of the newly installed capacity: North China added 6,116 MW, an increase of 47% YoY, and accounting for 25.2% of nationwide installations;Northeast China added 2,064 MW, down 4% YoY, and accounting for 8.5% of nationwide installations;East China added 6,218 MW, down 25% YoY, and accounting for 25.6% of nationwide installations;Central China added 3,878 MW, down 8% YoY, and accounting for 15.9% of nationwide installations;Northwest China added 4,120 MW, down 1% YoY, and accounting for 17.0% of nationwide installations;Southern China added 1,918 MW, an increase of 33% YoY, and accounting for 7.9% of nationwide installations。The development of distributed PV continued to maintain rapid growth. Over the first half of 2018, with newly installed capacity exceeding 1,000 MW in the four provinces of Shandong, Zhejiang, Henan and Jiangsu, which together accounted for 52.6% of nationwide installations of distributed PV。
Annex:For detailed construction and operational statistics of PV by province (autonomous region, municipality) during the first half of 2018, see the attached table
Annex:
National PV construction & operational statistics for H1 2018
| Province (autonomous region, municipality) | Cumulative installed capacity (MW) | Newly installed capacity (MW) | ||
| Of which:utility scale PV plants | Of which:utility scale PV plants | |||
| Total | 154,510 | 112,600 | 24,310 | 12,060 |
| Beijing | 310 | 50 | 60 | 0 |
| Tianjin | 1,010 | 790 | 330 | 260 |
| Hebei | 10,700 | 7,650 | 2,020 | 1,040 |
| Shanxi | 7,080 | 5,970 | 1,170 | 670 |
| Inner Mongolia | 8,480 | 8,390 | 1,050 | 980 |
| Liaoning | 2,590 | 1,900 | 360 | 60 |
| Jilin | 1,980 | 1,410 | 390 | 330 |
| Heilongjiang | 1,750 | 1,350 | 810 | 640 |
| Shanghai | 770 | 40 | 190 | 20 |
| Jiangsu | 11,470 | 6,740 | 2,400 | 910 |
| Zhejiang | 9,930 | 3,300 | 1,790 | 150 |
| Anhui | 10,410 | 6,360 | 1,530 | 710 |
| Fujian | 1,230 | 360 | 310 | 20 |
| Jiangxi | 4,930 | 2,860 | 430 | 90 |
| Shandong | 12,510 | 6,070 | 1,990 | 270 |
| Henan | 9,180 | 5,850 | 2,150 | 550 |
| Hubei | 4,610 | 3,170 | 470 | 130 |
| Hunan | 2,260 | 1,010 | 500 | 160 |
| Guangdong | 4,200 | 2,140 | 890 | 210 |
| Guangxi | 930 | 740 | 240 | 100 |
| Hainan | 460 | 330 | 140 | 70 |
| Chongqing | 420 | 390 | 290 | 280 |
| Sichuan | 1,380 | 1,280 | 40 | 20 |
| Guizhou | 1,620 | 1,560 | 250 | 210 |
| Yunnan | 2,730 | 2,620 | 400 | 330 |
| Tibet | 840 | 840 | 50 | 50 |
| Shaanxi | 5,930 | 5,270 | 690 | 510 |
| Gansu | 7,860 | 7,660 | 20 | 0 |
| Qinghai | 9,500 | 9,410 | 1,590 | 1,560 |
| Ningxia | 7,710 | 7,370 | 1,510 | 1,490 |
| Xinjiang | 9,350 | 9,340 | 270 | 260 |
| XPCC | 390 | 390 | 0 | 0 |
Note:1. The above statistics do not include Hong Kong, Macao and Taiwan;
2. Data source:National Renewable Energy Center。


