
All translations on this site are unofficial and provided for reference purpose only.
To view translations, select English under Step 1 (at the right of the screen). Not every item is (fully) translated. If you’re still seeing Chinese, you can use machine translation, under Step 2, to make sense of the rest.
Want to help translate? Switch to English under Step 1, and check ‘edit translation’ (more explanation in the FAQ). Even if you translate just a few lines, this is still very much appreciated! Remember to log in if you would like to be credited for your effort. If you’re unsure where to start translating, please see the list of Most wanted translations.
2018 Q1-3 wind power installations and production by province
Original title: 2018年前三季度风电并网运行情况
Links: Source document (in Chinese) (link). Same stats for (Q3 2017) (Q3 2016).
According to industry statistics, from January to September 2018, nationwide additions of wind power capacity was 12,610 MW. Total installed wind power capacity reached 176 GW by the end of September;From January to September, nationwide wind power production was 267.6 TWh, an increase of 26% on the same period last year;average productivity was 1565 full-load hours, an increase of 178 hours on the same period last year;From January to September, nationwide curtailment of wind power was 22.2 TWh, down 7.4 TWh on the same period last year。
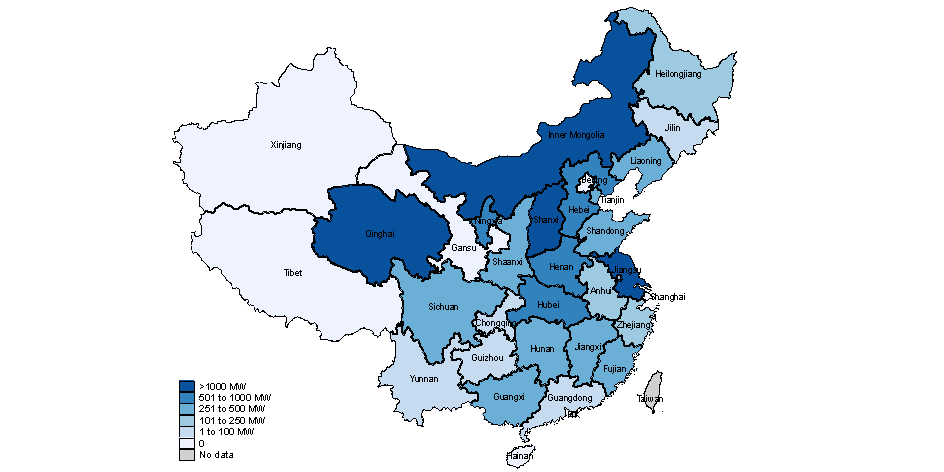
From January to September, the provinces with relatively large additions to wind power capacity were Inner Mongolia (1,930 MW), Jiangsu (1,560 MW), Shanxi (1,170 MW), Qinghai (1,100 MW), and Henan (860 MW)。Provinces with the highest average productivity were Shanghai (1909 full-load hours), Jiangsu (1857 hours), Yunnan (1848 hours), Liaoning (1750 hours), and Fujian (1722 hours)。
Wind power additions (MW), year to date
2018 Q1-3 wind power installations and production by province
| Province (autonomous region, municipality) | Grid-connected capacity, additions | Grid-connected capacity, cumulative | Power production | Curtailment | Wind power curtailment (% of all) | Full-load hours | Provincial target for maximum annual curtailment |
| Total | 12,610 | 175,920 | 267,600 | 22,200 | 7.70% | 1565 | |
| Beijing | 0 | 190 | 250 | 1310 | 0% | ||
| Tianjin | 270 | 520 | 590 | 1432 | 0% | ||
| Hebei | 610 | 12,410 | 20,450 | 790 | 3.70% | 1675 | 6.7% (Northern Hebei renewable power avg.) |
| Shanxi | 1,170 | 9,780 | 15,080 | 1590 | 4.2% (renewable power avg.) | ||
| Inner Mongolia | 1,930 | 28,320 | 44,500 | 6,550 | 12.80% | 1572 | 12% |
| Liaoning | 290 | 7,390 | 12,640 | 130 | 1.00% | 1750 | 8% |
| Jilin | 90 | 5,140 | 7,520 | 420 | 5.20% | 1480 | — |
| Heilongjiang | 160 | 5,860 | 8,470 | 340 | 3.90% | 1467 | — |
| Shanghai | 0 | 710 | 1,360 | 1909 | 0% | ||
| Jiangsu | 1,560 | 7,910 | 12,810 | 1857 | 0% | ||
| Zhejiang | 110 | 1,430 | 2,180 | 1568 | 0% | ||
| Anhui | 110 | 2,380 | 3,580 | 1568 | Guarantee 10%, strive for 0% | ||
| Fujian | 380 | 2,890 | 4,710 | 1722 | 0% | ||
| Jiangxi | 480 | 2,210 | 2,970 | 1427 | 0% | ||
| Shandong | 360 | 10,930 | 17,020 | 1591 | Circa 2% | ||
| Henan | 860 | 3,260 | 4,060 | 1356 | 0% | ||
| Hubei | 790 | 3,240 | 4,790 | 1667 | Guarantee 10%, strive for 0% | ||
| Hunan | 430 | 3,060 | 4,370 | 1566 | 4% (renewable power avg.) | ||
| Guangdong | 8 | 3,480 | 4,370 | 1280 | 0% | ||
| Guangxi | 370 | 1,970 | 2,880 | 1627 | 0% | ||
| Hainan | 0 | 340 | 380 | 1119 | — | ||
| Chongqing | 50 | 390 | 580 | 1573 | 0% | ||
| Sichuan | 330 | 2,420 | 3,460 | 1545 | 0% | ||
| Guizhou | 50 | 3,770 | 5,210 | 90 | 1.80% | 1402 | 3% |
| Yunnan | 4 | 8,320 | 15,390 | 1848 | Guarantee 10%, strive for 0% | ||
| Tibet | 0 | 10 | 10 | 1325 | — | ||
| Shaanxi | 460 | 4,050 | 5,310 | 120 | 2.30% | 1508 | Wind power curtailment reduced by 1.8% on last year, limit to 2.2% |
| Gansu | 0 | 12,820 | 17,610 | 4,330 | 19.70% | 1366 | 23% |
| Qinghai | 1,100 | 2,670 | 2,880 | 40 | 1.30% | 1200 | 0% |
| Ningxia | 640 | 10,010 | 14,490 | 230 | 1.60% | 1475 | — |
| Xinjiang | 0 | 18,060 | 27,650 | 9,030 | 24.60% | 1531 | 26% |
Notes: 1. Unit of installed capacity:MW;Generation unit:GWh;
2. Source of statistics on grid-connected installed capacity, power production, and productivity is the CEC;
3. Sources of statistics on curtailment and curtailment rates are the National Renewable Energy Center, and relevant grid enterprises。
4.各省承诺的全年弃风率控制目标为各省(区、市)在落实《解决弃水弃风弃光问题实施方案》工作方案中承诺的2018年全年弃风率控制目标,“–”表示工作方案中未提出弃风控制目标。


