
All translations on this site are unofficial and provided for reference purpose only.
To view translations, select English under Step 1 (at the right of the screen). Not every item is (fully) translated. If you’re still seeing Chinese, you can use machine translation, under Step 2, to make sense of the rest.
Want to help translate? Switch to English under Step 1, and check ‘edit translation’ (more explanation in the FAQ). Even if you translate just a few lines, this is still very much appreciated! Remember to log in if you would like to be credited for your effort. If you’re unsure where to start translating, please see the list of Most wanted translations.
2019 Q1 wind power installations and production by province
Original title: 2019年一季度风电并网运行情况
Links: Original source (in Chinese) (link). Same statistics for (Q1 2018) (Q1 2017) (Q1 2016).
Q1 2019 wind power operational statistics
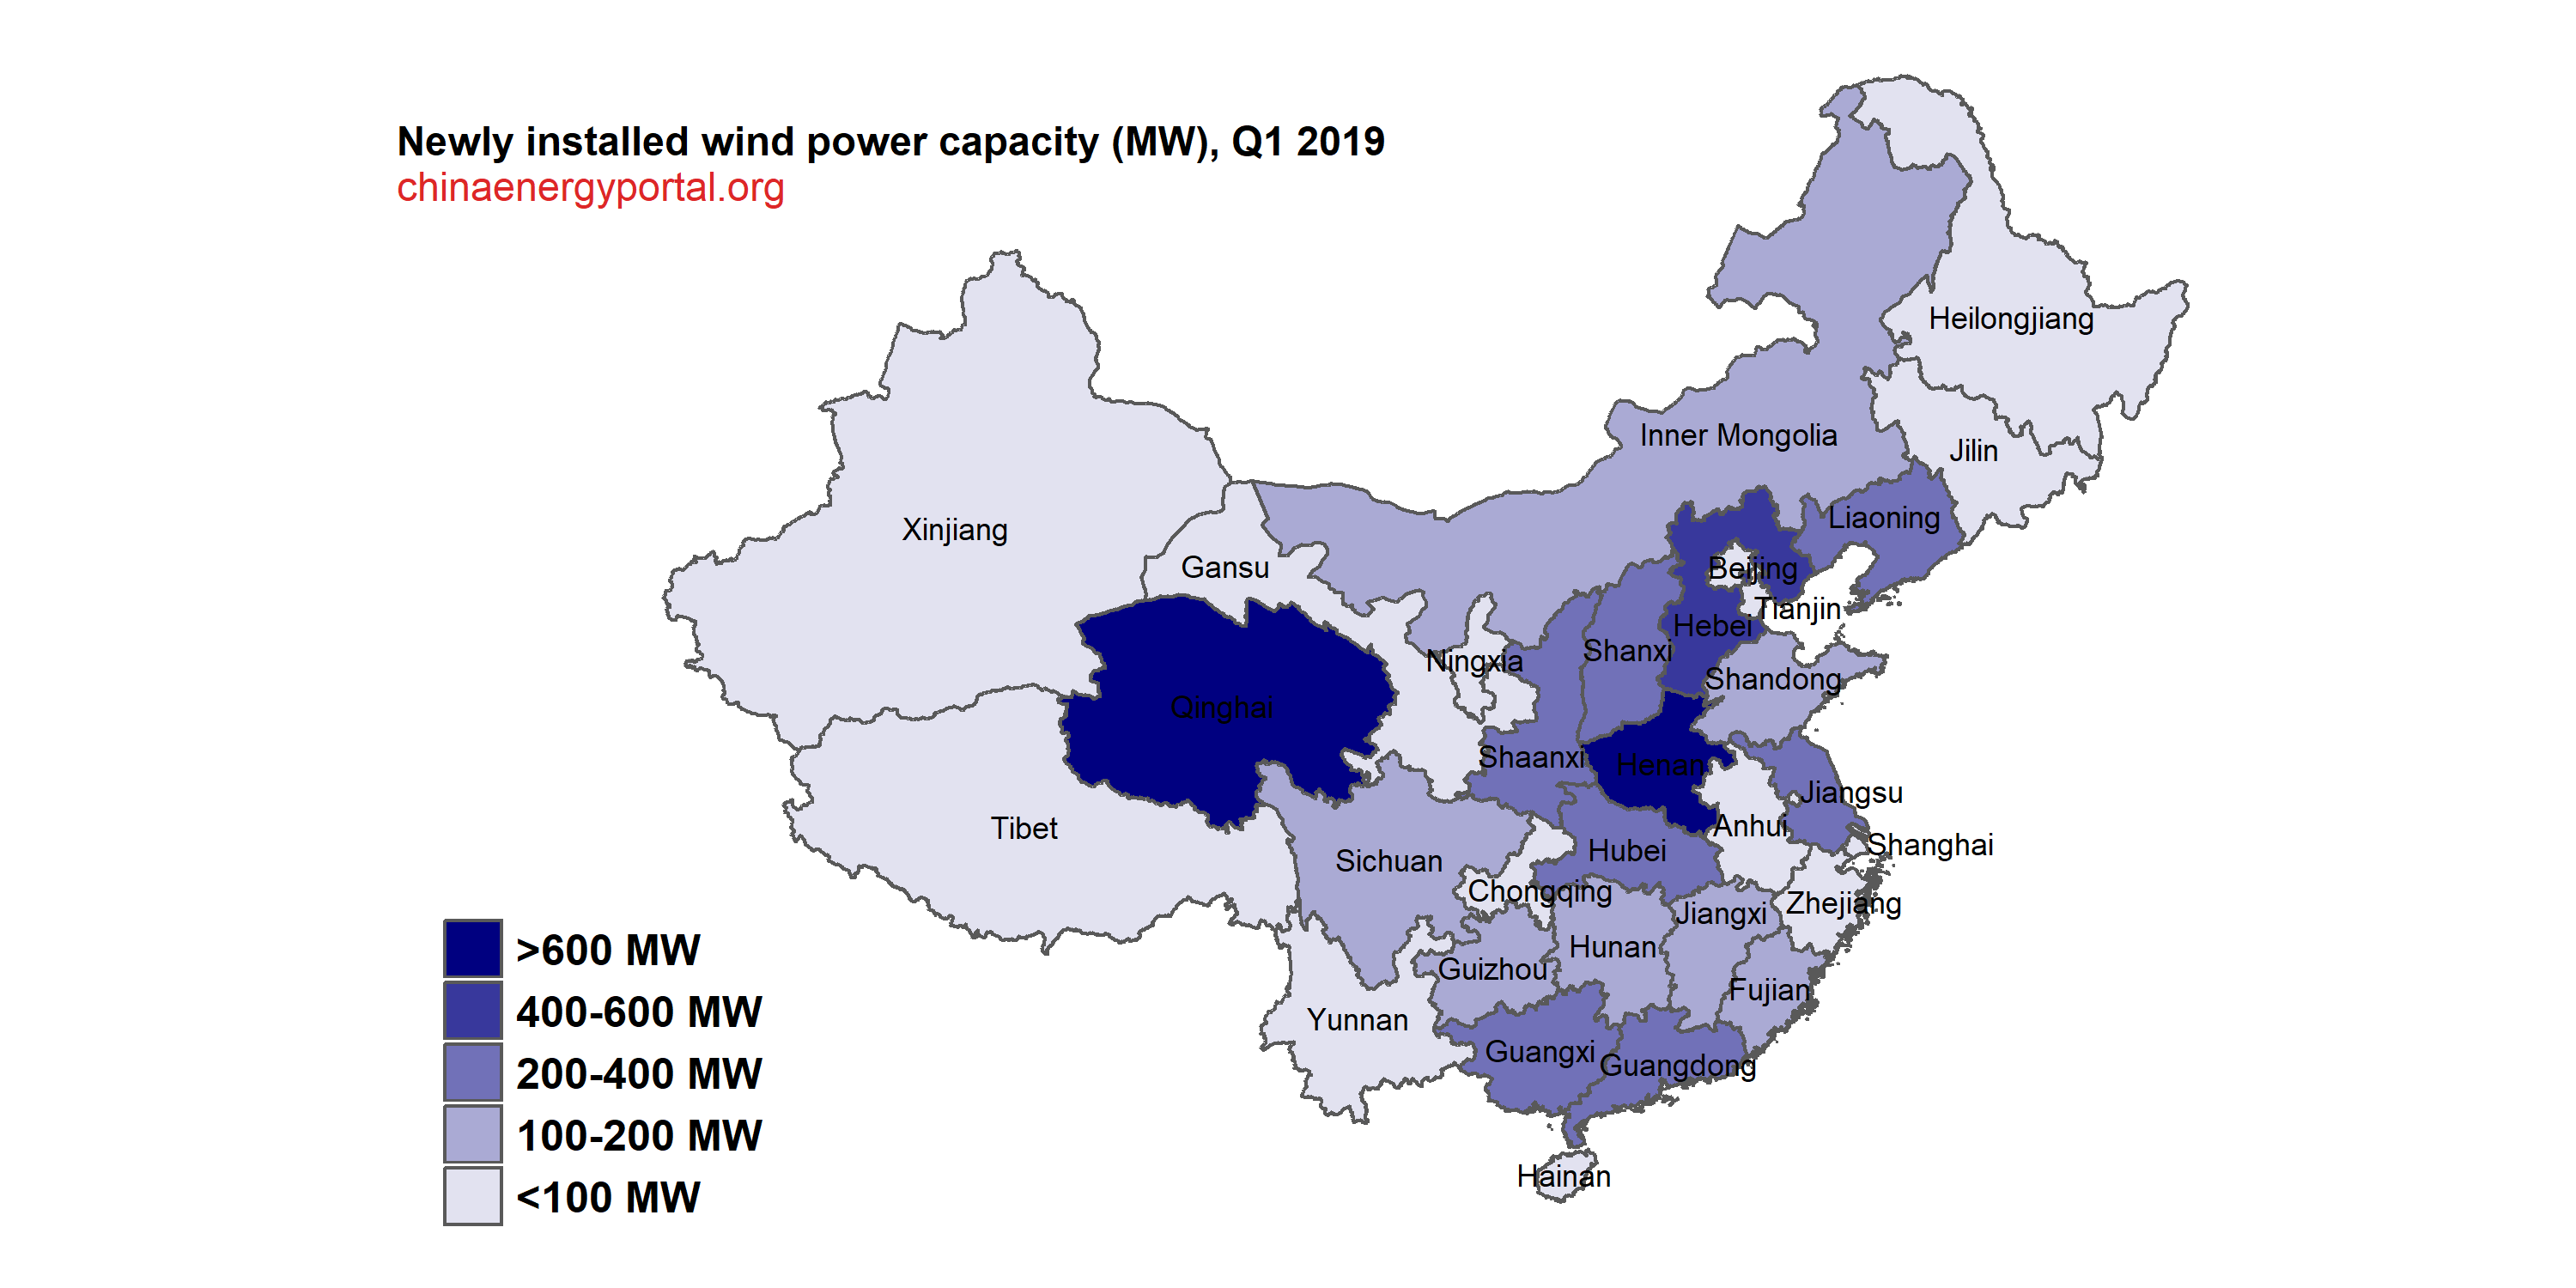
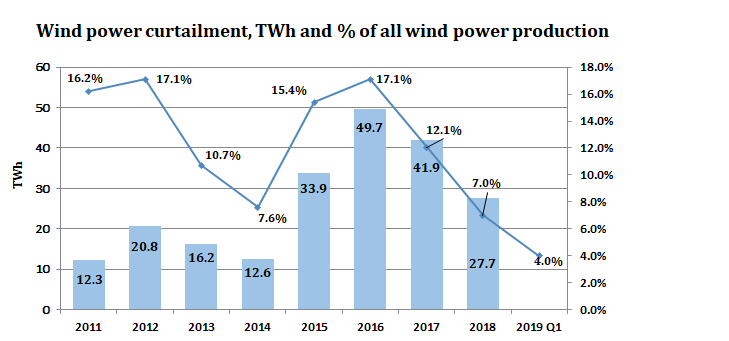
According to industry statistics, from January to March 2019, nationwide newly installed wind power capacity was 4.78 GW, of which 120 MW offshore wind power. Cumulative grid-connected installed capacity reached 189 GW。In January through March 2019, nationwide generation of wind power was 104.1 TWh, an increase of 6.3% on the same period last year;Average wind power productivity was 556 full-load hours, down 37 hours from last year。In January through March, total curtailment of wind power was 4.3 TWh, down 4.8 TWh on the same period last year;The national average wind power curtailment rate was 4.0%, down 4.5 percentage points on the same period last year。This continued a trend of a "double reduction" of curtailment and curtailment rate。
In January through March 2019, provinces with relatively higher wind power productivity were Yunnan (1078 full-load hours), and Sichuan (1048 full-load hours)。
In January through March 2019, curtailment was still relatively severe in Xinjiang (curtailment rate of 15.2%, with curtailment of 1370 GWh of wind power), Gansu (curtailment rate of 9.5%, with curtailment of 550 GWh of wind power), and Inner Mongolia (curtailment rate of 7.4%, with curtailment of 1300 GWh of wind power)。
| Province (autonomous region, municipality) | Newly installed grid-connected generation capacity (MW) | Cumulative grid-connected generation capacity (MW) | Electricity production (GWh) | Wind power curtailment (GWh) | Wind power curtailment (% of all) | Full-load hours |
| Total | 4,620 | 188,880 | 104,100 | 4350 | 4.00% | 556 |
| Beijing | 0 | 190 | 130 | 683 | ||
| Tianjin | 0 | 520 | 300 | 578 | ||
| Hebei | 480 | 14,390 | 8,960 | 480 | 5.10% | 631 |
| Shanxi | 300 | 10,730 | 5,950 | 100 | 1.60% | 555 |
| Inner Mongolia | 100 | 28,790 | 17,290 | 1300 | 7.40% | 602 |
| Liaoning | 230 | 7,840 | 4,780 | 40 | 0.70% | 614 |
| Jilin | 0 | 5,140 | 3,080 | 140 | 4.30% | 599 |
| Heilongjiang | 20 | 6,000 | 4,070 | 110 | 2.60% | 678 |
| Shanghai | 0 | 710 | 420 | 546 | ||
| Jiangsu | 210 | 8,860 | 4,350 | 516 | ||
| Zhejiang | 60 | 1,540 | 820 | 542 | ||
| Anhui | 60 | 2,520 | 1,100 | 438 | ||
| Fujian | 100 | 3,100 | 2,200 | 719 | ||
| Jiangxi | 160 | 2,410 | 1,310 | 560 | ||
| Shandong | 140 | 11,600 | 5,410 | 20 | 0.40% | 470 |
| Henan | 660 | 5,340 | 1,890 | 363 | ||
| Hubei | 350 | 3,660 | 1,480 | 411 | ||
| Hunan | 180 | 3,660 | 2,020 | 562 | ||
| Guangdong | 340 | 3,910 | 1,910 | 489 | ||
| Guangxi | 280 | 2,360 | 1,710 | 753 | ||
| Hainan | -50 | 290 | 110 | 374 | ||
| Chongqing | 0 | 500 | 180 | 370 | ||
| Sichuan | 110 | 2,640 | 2,820 | 1048 | ||
| Guizhou | 130 | 3,990 | 2,410 | 30 | 1.30% | 627 |
| Yunnan | 10 | 8,580 | 9,270 | 30 | 0.30% | 1078 |
| Tibet | -2 | 8 | 10 | 894 | ||
| Shaanxi | 350 | 4,400 | 1,850 | 40 | 2.10% | 445 |
| Gansu | 0 | 12,820 | 5,200 | 550 | 9.50% | 402 |
| Qinghai | 650 | 3,320 | 1,360 | 20 | 1.20% | 412 |
| Ningxia | 0 | 10,110 | 4,130 | 130 | 3.10% | 408 |
| Xinjiang | -250 | 18,960 | 7,640 | 1370 | 15.20% | 403 |
Notes: 1. Unit of installed capacity:MW;Generation unit:GWh;
2. Source of statistics on grid-connected installed capacity, power production, and productivity is the CEC;
3. Sources of statistics on curtailment and curtailment rates are the National Renewable Energy Center, and relevant grid enterprises。Blank cells indicates no curtailment occurred。
[newly added installations added by China Energy Portal, based on same stats for year-end 2018 (link)]


