
All translations on this site are unofficial and provided for reference purpose only.
To view translations, select English under Step 1 (at the right of the screen). Not every item is (fully) translated. If you’re still seeing Chinese, you can use machine translation, under Step 2, to make sense of the rest.
Want to help translate? Switch to English under Step 1, and check ‘edit translation’ (more explanation in the FAQ). Even if you translate just a few lines, this is still very much appreciated! Remember to log in if you would like to be credited for your effort. If you’re unsure where to start translating, please see the list of Most wanted translations.
2019 wind power installations and production by province
Original title: 2019年风电并网运行情况
Links: Source document (in Chinese) (link). Same statistics for (2018) (2017) (2016) (2015) 2014) (2013).
According to industry statistics, nationwide newly installed capacity of wind power in 2019 was 25.74 GW. Of this, 23.76 GW was onshore wind power, and 1.98 GW was offshore wind power. By the end of 2019, the national total cumulative installed capacity of wind power reached 210 GW, of which 204 GW onshore, 5.93 GW offshore wind power. Wind power now accounts for 10.4% of all power generation capacity。Wind power generation in 2019 was 405.7 TWh, exceeding the 400 TWh mark for the first time, and accounting for 5.5% of total power generation。
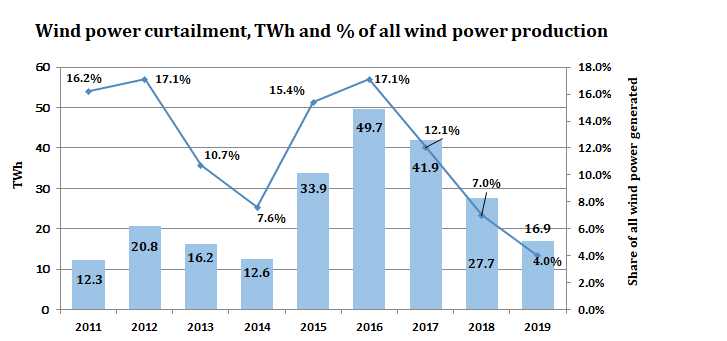
In 2019, the national average productivity of wind power was 2082 full-load hours. Regions with relatively high wind power productivity were Yunnan (2808 full-load hours), Fujian (2639 hours), Sichuan (2553 hours), Guangxi (2385 hours), and Heilongjiang (2323 hours)。Wind power curtailment was 16.9 TWh in 2019, a year-on-year decrease of 10.8 TWh. The average wind power curtailment rate was 4%, a decrease of 3 percentage points year-on-year, meaning curtailment issues have further eased。
In 2019, administrative areas with curtailment rates of wind power exceeding 5% were Xinjiang (wind power curtailment rate of 14.0%, and total wind power curtailment of 6.61 TWh), Gansu (curtailment rate of 7.6%, and total wind power curtailment 1.88 TWh), and Inner Mongolia (curtailment rate of 7.1% and total wind power curtailment of 5.12 TWh)。Added together, total wind power curtailment in these three provinces (autonomous regions) was 13.6 TWh, accounting for 81% of the national total wind power curtailment。
2019 grid-connected wind power operational statistics
| Province (autonomous region, municipality) | Newly installed grid-connected generation capacity (MW) | Cumulative grid-connected generation capacity (MW) | Electricity production (GWh) | Wind power curtailment (GWh) | Wind power curtailment (% of all) | Full-load hours |
| National | 25,790 | 210,050 | 405,700 | 16,860 | 4.00% | 2082 |
| Beijing | 0 | 190 | 300 | 1816 | ||
| Tianjin | 80 | 600 | 1,100 | 1965 | ||
| Hebei | 2,480 | 16,390 | 31,800 | 1,600 | 4.80% | 2144 |
| Shanxi | 2,080 | 12,510 | 22,400 | 260 | 1.10% | 1918 |
| Inner Mongolia | 1,380 | 30,070 | 66,600 | 5,120 | 7.10% | 2305 |
| Liaoning | 710 | 8,320 | 18,300 | 80 | 0.40% | 2300 |
| Jilin | 430 | 5,570 | 11,500 | 300 | 2.50% | 2216 |
| Heilongjiang | 130 | 6,110 | 14,000 | 180 | 1.30% | 2323 |
| Shanghai | 100 | 810 | 1,700 | 2065 | ||
| Jiangsu | 1,760 | 10,410 | 18,400 | 1973 | ||
| Zhejiang | 120 | 1,600 | 3,300 | 2090 | ||
| Anhui | 280 | 2,740 | 4,700 | 1809 | ||
| Fujian | 760 | 3,760 | 8,700 | 2639 | ||
| Jiangxi | 610 | 2,860 | 5,100 | 2028 | ||
| Shandong | 2,080 | 13,540 | 22,500 | 30 | 0.10% | 1863 |
| Henan | 3,260 | 7,940 | 8,800 | 1480 | ||
| Hubei | 740 | 4,050 | 7,400 | 1960 | ||
| Hunan | 790 | 4,270 | 7,500 | 140 | 1.80% | 1960 |
| Guangdong | 860 | 4,430 | 7,100 | 1612 | ||
| Guangxi | 790 | 2,870 | 6,100 | 2385 | ||
| Hainan | -50 | 290 | 500 | 1645 | ||
| Chongqing | 140 | 640 | 1,100 | 1996 | ||
| Sichuan | 720 | 3,250 | 7,100 | 2553 | ||
| Guizhou | 710 | 4,570 | 7,800 | 30 | 0.40% | 1861 |
| Yunnan | 60 | 8,630 | 24,200 | 60 | 0.20% | 2808 |
| Tibet | -2 | 8 | 20 | 2173 | ||
| Shaanxi | 1,270 | 5,320 | 8,300 | 50 | 0.60% | 1931 |
| Gansu | 150 | 12,970 | 22,800 | 1,880 | 7.60% | 1787 |
| Qinghai | 1,950 | 4,620 | 6,600 | 170 | 2.50% | 1743 |
| Ningxia | 1,050 | 11,160 | 18,600 | 360 | 1.90% | 1811 |
| Xinjiang | 350 | 19,560 | 41,300 | 6,610 | 14.00% | 2147 |
[newly added installations added by China Energy Portal, based on same stats for 2018]
Notes:
1.Capacity unit:MW;Generation unit:GWh;
2.The source of statistics for grid-connected capacity, power production, and hours of utilization is the China Electricity Council;
3.Sources of statistics on curtailment and curtailment rates are the National Renewable Energy Center, and relevant grid enterprises。Blank cells indicates no curtailment occurred。


