
All translations on this site are unofficial and provided for reference purpose only.
To view translations, select English under Step 1 (at the right of the screen). Not every item is (fully) translated. If you’re still seeing Chinese, you can use machine translation, under Step 2, to make sense of the rest.
Want to help translate? Switch to English under Step 1, and check ‘edit translation’ (more explanation in the FAQ). Even if you translate just a few lines, this is still very much appreciated! Remember to log in if you would like to be credited for your effort. If you’re unsure where to start translating, please see the list of Most wanted translations.
2020 Q2 PV installations utility and distributed by province
Original title: 2020年上半年光伏发电建设运行情况
Links: Source document (in Chinese) (link). Same statistics for (2019) (2018) (2017) (2016) (2015).
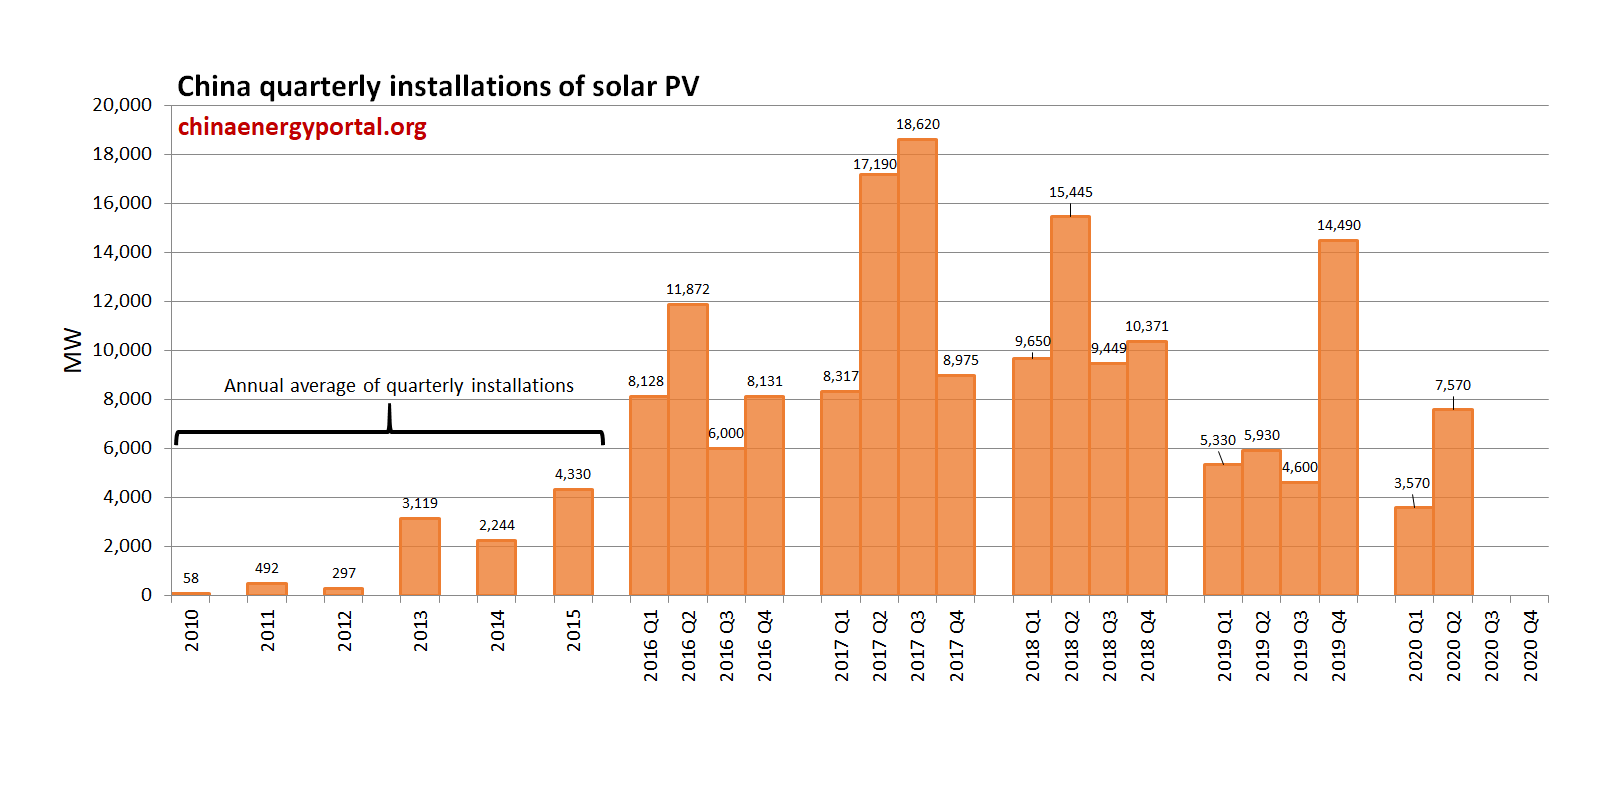
According to industry statistics, in the first half of 2020, China's newly installed PV capacity was 11.52 GW, of which 7.082 GW utility-scale PV and 4.435 GW of distributed PV。By the end of June, cumulative installed PV capacity reached 216 GW, including 149 GW utility-scale PV and 67.07 GW distributed PV。Considering the geographical distribution of newly installed capacity, North China and East China saw relatively large additions,. with 4.39 GW and 2.19 GW respectively。
In the first half of the year, nationwide PV power generation was 127.8 TWh, a year-on-year increase of 20%;Nationwide PV productivity was 595 full-load hours, a year-on-year increase of 19 hours。Northeast China had the highest productivity, reaching 771 full-load hours, a year-on-year decrease of 19 hours;Central China had the lowest productivity, at 493 full-load hours, a year-on-year increase of 46 hours。
2020 H1 PV installation and operational statistics
| Province (autonomous region, municipality) | Cumulative installed capacity (MW) | Newly installed capacity (MW) | ||
| Of which:utility scale PV plants | Of which:utility scale PV plants | |||
| Total | 215,820 | 148,750 | 11,520 | 7,080 |
| Beijing | 600 | 50 | 90 | 0 |
| Tianjin | 1,510 | 1,100 | 90 | 60 |
| Hebei | 15,710 | 10,180 | 970 | 560 |
| Shanxi | 11,980 | 9,630 | 1,100 | 1,060 |
| Inner Mongolia | 11,310 | 10,480 | 500 | 470 |
| Liaoning | 3,690 | 2,680 | 260 | 220 |
| Jilin | 3,260 | 2,550 | 520 | 500 |
| Heilongjiang | 2,870 | 2,050 | 120 | 100 |
| Shanghai | 1,170 | 60 | 80 | 0 |
| Jiangsu | 15,990 | 8,830 | 1,130 | 620 |
| Zhejiang | 14,090 | 4,280 | 700 | 140 |
| Anhui | 12,720 | 7,740 | 190 | 10 |
| Fujian | 1,790 | 380 | 100 | 0 |
| Jiangxi | 6,780 | 3,940 | 480 | 270 |
| Shandong | 18,010 | 7,390 | 1,810 | 620 |
| Henan | 10,890 | 6,000 | 350 | 0 |
| Hubei | 6,470 | 4,400 | 260 | 200 |
| Hunan | 3,600 | 1,690 | 160 | 140 |
| Guangdong | 6,970 | 3,710 | 870 | 690 |
| Guangxi | 1,650 | 1,320 | 300 | 270 |
| Hainan | 1,400 | 1,270 | 0 | 0 |
| Chongqing | 650 | 580 | 0 | 0 |
| Sichuan | 1,890 | 1,690 | 10 | 0 |
| Guizhou | 5,370 | 5,180 | 270 | 270 |
| Yunnan | 3,890 | 3,520 | 140 | 20 |
| Tibet | 1,280 | 1,280 | 180 | 180 |
| Shaanxi | 9,530 | 7,810 | 130 | 30 |
| Gansu | 9,110 | 8,380 | 40 | 20 |
| Qinghai | 11,020 | 10,860 | 10 | 0 |
| Ningxia | 9,830 | 9,080 | 650 | 640 |
| Xinjiang | 10,420 | 10,270 | 10 | 0 |
| XPCC | 390 | 390 | 0 | 0 |
Note:1.由于取整,分项和与合计数有误差;2. The above statistics do not include Hong Kong, Macao and Taiwan;3. Data source:National Renewable Energy Center。


