
All translations on this site are unofficial and provided for reference purpose only.
To view translations, select English under Step 1 (at the right of the screen). Not every item is (fully) translated. If you’re still seeing Chinese, you can use machine translation, under Step 2, to make sense of the rest.
Want to help translate? Switch to English under Step 1, and check ‘edit translation’ (more explanation in the FAQ). Even if you translate just a few lines, this is still very much appreciated! Remember to log in if you would like to be credited for your effort. If you’re unsure where to start translating, please see the list of Most wanted translations.
2017 PV installations utility and distributed by province
Original title: 2017年光伏发电统计信息
Links: Original CN (link). Same statistics for: (2018) (2017) (2016) (2015) (2014) (2013) (2012).
Note: no official stats published online. Calculated instead from PV statistics for 2018 & 2016.
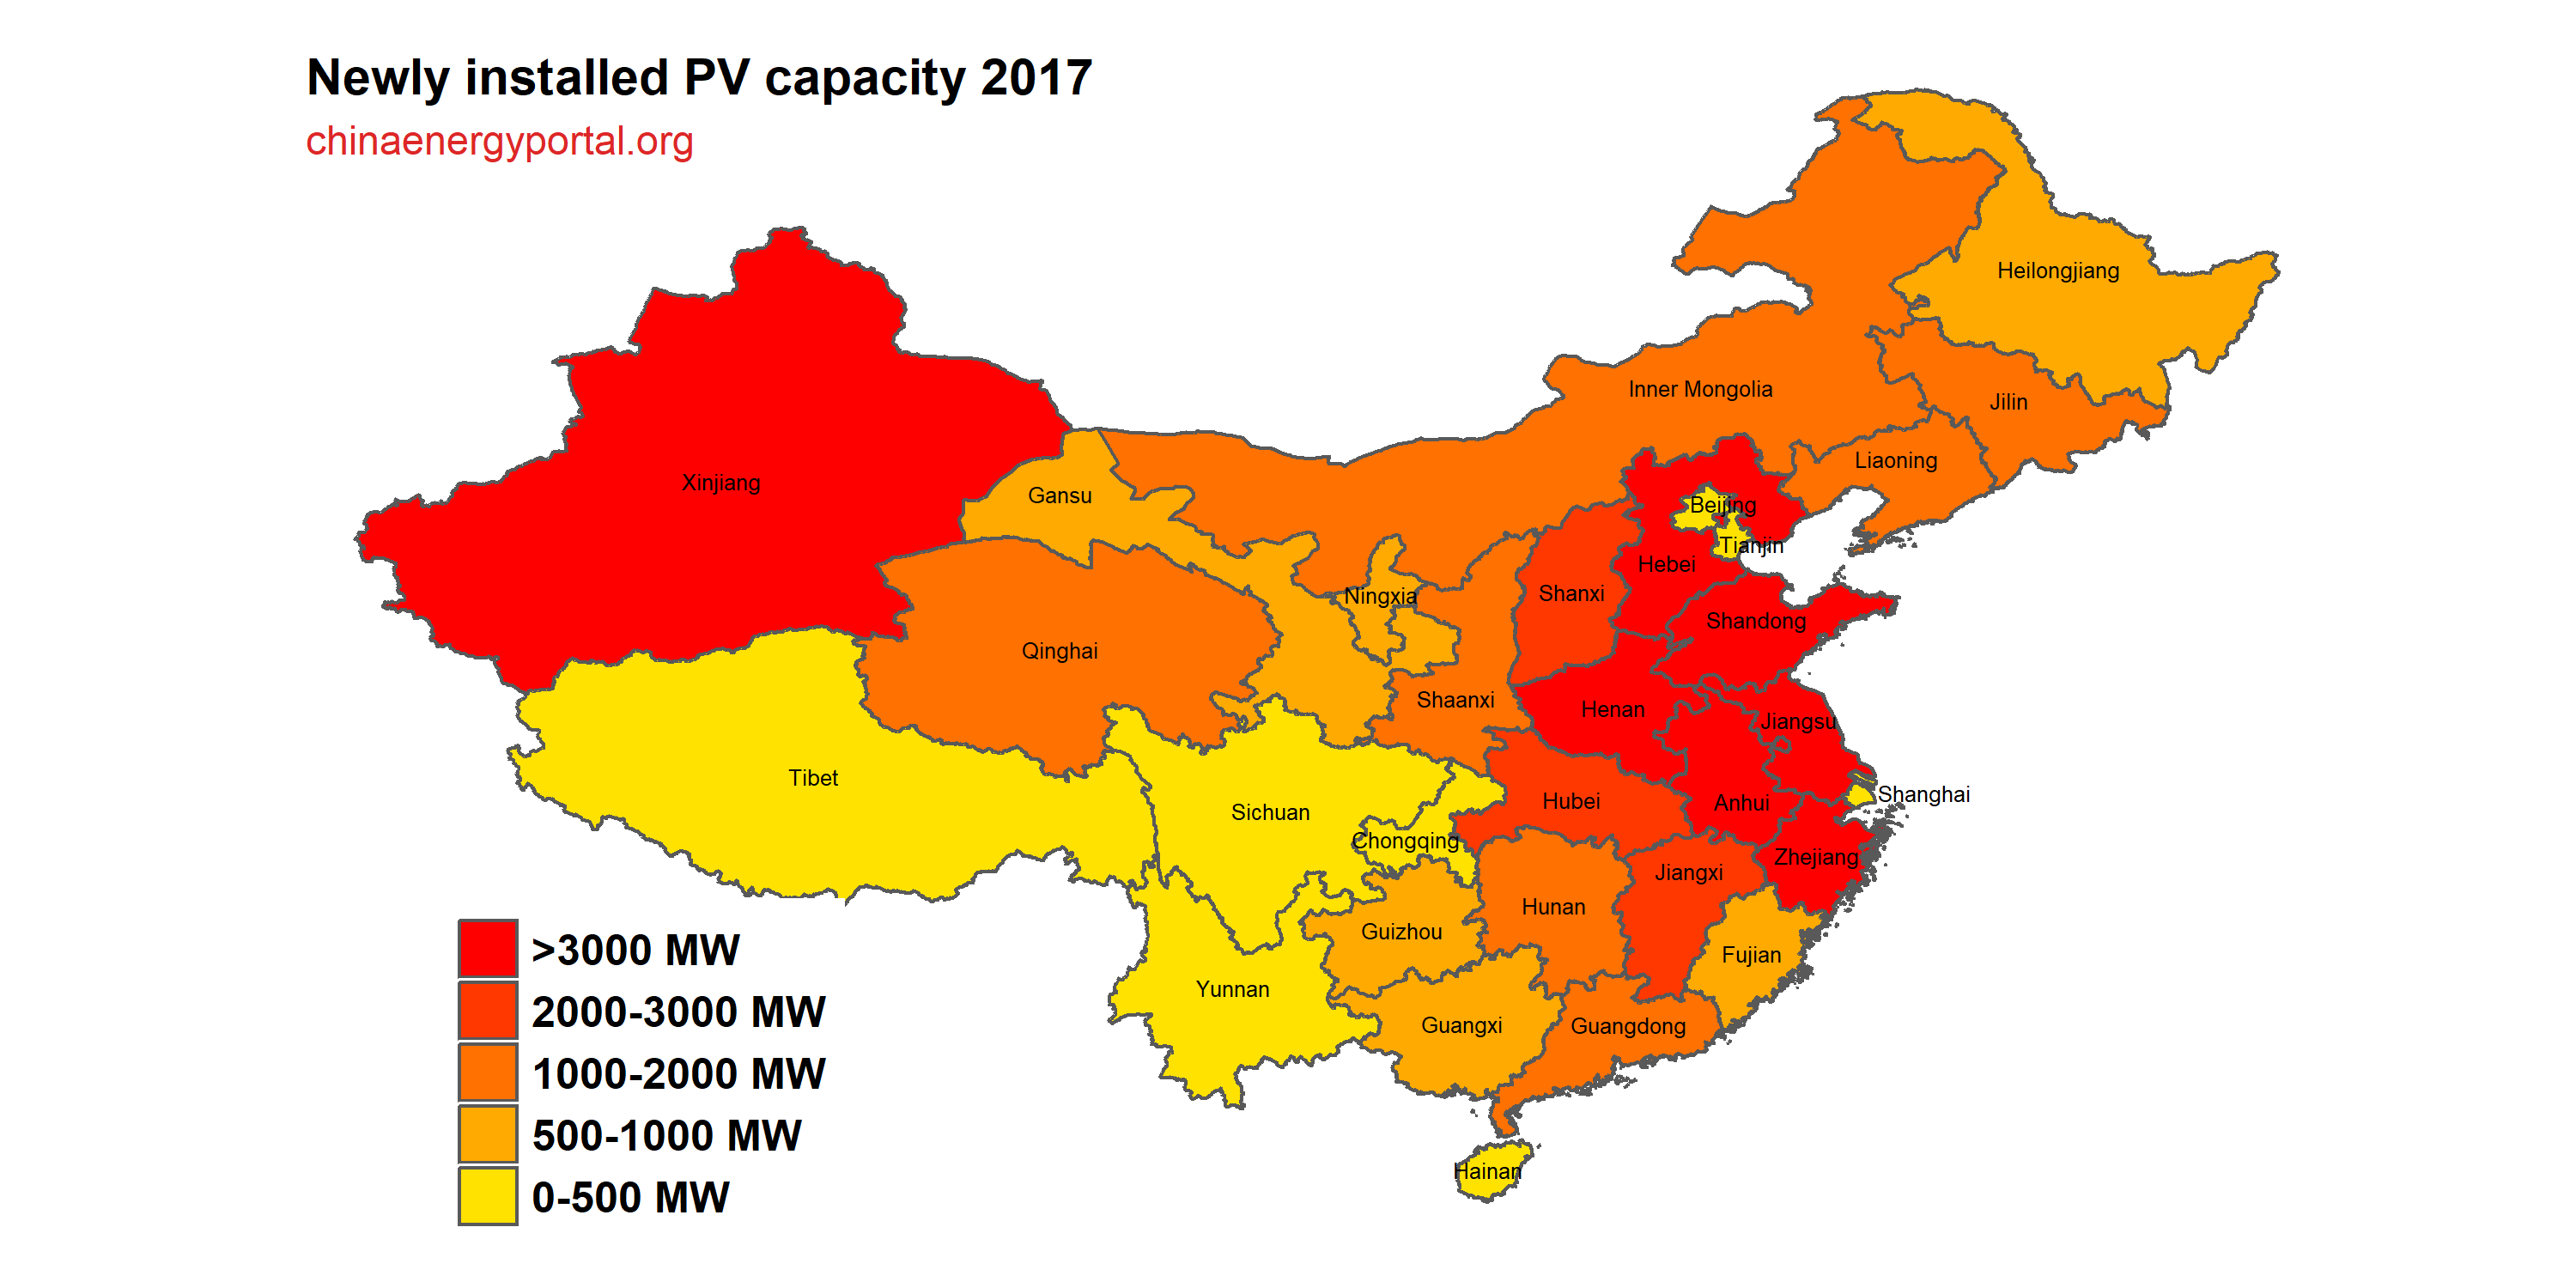
2017年光伏发电统计信息表
| 省(区、市) | 累计装机容量(MW) | 其中:光伏电站 | 新增装机容量(MW) | 其中:光伏电站 |
| 总计 | 130,200 | 100,540 | 52,780 | 33,440 |
| 北京 | 250 | 50 | 10 | 0 |
| 天津 | 680 | 530 | 80 | 50 |
| 河北 | 8,680 | 6,610 | 4,250 | 2,570 |
| 山西 | 5,900 | 5,300 | 2,930 | 2,460 |
| 内蒙古 | 7,430 | 7,410 | 1,060 | 1,040 |
| 辽宁 | 2,230 | 1,850 | 1,710 | 1,490 |
| 吉林 | 1,590 | 1,080 | 1,030 | 570 |
| 黑龙江 | 940 | 710 | 770 | 590 |
| 上海 | 580 | 20 | 230 | 0 |
| 江苏 | 9,070 | 5,840 | 3,610 | 2,110 |
| 浙江 | 8,140 | 3,150 | 4,760 | 1,840 |
| 安徽 | 8,880 | 5,650 | 5,430 | 2,980 |
| 福建 | 930 | 340 | 660 | 230 |
| 江西 | 4,490 | 2,770 | 2,210 | 1,060 |
| 山东 | 10,520 | 5,810 | 5,970 | 2,450 |
| 河南 | 7,040 | 5,300 | 4,200 | 2,820 |
| 湖北 | 4,130 | 3,030 | 2,260 | 1,360 |
| 湖南 | 1,750 | 850 | 1,450 | 850 |
| 广东 | 3,310 | 1,930 | 1,750 | 1,250 |
| 广西 | 690 | 630 | 510 | 540 |
| 海南 | 340 | 270 | 0 | 30 |
| 重庆 | 130 | 110 | 125 | 110 |
| 四川 | 1,350 | 1,260 | 390 | 360 |
| 贵州 | 1,370 | 1,350 | 910 | 890 |
| 云南 | 2,340 | 2,280 | 260 | 200 |
| 西藏 | 800 | 800 | 470 | 470 |
| 陕西 | 5,240 | 4,750 | 1,900 | 1,530 |
| 甘肃 | 7,840 | 7,660 | 980 | 860 |
| 青海 | 7,900 | 7,850 | 1,080 | 1,030 |
| 宁夏 | 6,200 | 5,880 | 940 | 830 |
| 新疆 | 17,390 | 16,810 | 8,770 | 8,190 |


