
All translations on this site are unofficial and provided for reference purpose only.
To view translations, select English under Step 1 (at the right of the screen). Not every item is (fully) translated. If you’re still seeing Chinese, you can use machine translation, under Step 2, to make sense of the rest.
Want to help translate? Switch to English under Step 1, and check ‘edit translation’ (more explanation in the FAQ). Even if you translate just a few lines, this is still very much appreciated! Remember to log in if you would like to be credited for your effort. If you’re unsure where to start translating, please see the list of Most wanted translations.
2019 wind power installations and production by province
Original title: 2019年风电并网运行情况
Links: Source document (in Chinese) (link). Same statistics for (2018) (2017) (2016) (2015) 2014) (2013).
据行业统计,2019年,全国风电新增并网装机2574万千瓦,其中陆上风电新增装机2376万千瓦、海上风电新增装机198万千瓦,到2019年底,全国风电累计装机2.1亿千瓦,其中陆上风电累计装机2,04亿千瓦、海上风电累计装机593万千瓦,风电装机占全部发电装机的10.4%。2019年风电发电量4057亿千瓦时,首次突破4000亿千瓦时,占全部发电量的5.5%。
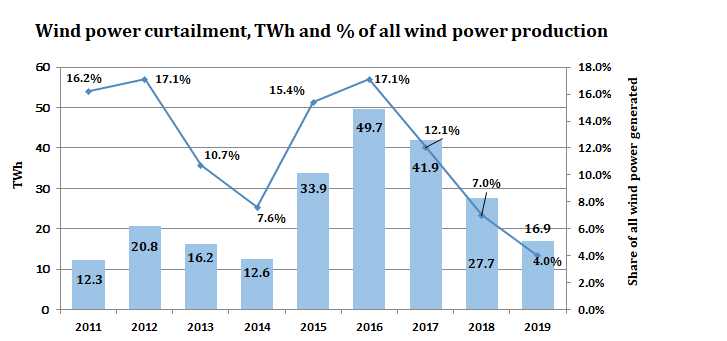
2019年,全国风电平均利用小时数2082小时,风电平均利用小时数较高的地区是云南(2808小时)、福建(2639小时)、四川(2553小时)、广西(2385小时)和黑龙江(2323小时)。2019年弃风电量169亿千瓦时,同比减少108亿千瓦时,平均弃风率4%,同比下降3个百分点,弃风限电状况进一步得到缓解。
2019年,弃风率超过5%的地区是新疆(弃风率14,0%、弃风电量66.1亿千瓦时),甘肃(弃风率7.6%、弃风电量18.8亿千瓦时),内蒙古(弃风率7.1%、弃风电量51.2亿千瓦时)。三省(区)弃风电量合计136亿千瓦时,占全国弃风电量的81%。
2019年风电并网运行统计数据
| 省(区、市) | 新增并网容量 (MW) | 累计并网容量 (MW) | 发电量 (GWh) | 弃风电量 (GWh) | 弃风率 | 利用小时数 |
| 全国 | 25,790 | 210,050 | 405,700 | 16,860 | 4.00% | 2082 |
| 北京 | 0 | 190 | 300 | 1816 | ||
| 天津 | 80 | 600 | 1,100 | 1965 | ||
| 河北 | 2,480 | 16,390 | 31,800 | 1,600 | 4.80% | 2144 |
| 山西 | 2,080 | 12,510 | 22,400 | 260 | 1.10% | 1918 |
| 内蒙古 | 1,380 | 30,070 | 66,600 | 5,120 | 7.10% | 2305 |
| 辽宁 | 710 | 8,320 | 18,300 | 80 | 0.40% | 2300 |
| 吉林 | 430 | 5,570 | 11,500 | 300 | 2.50% | 2216 |
| 黑龙江 | 130 | 6,110 | 14,000 | 180 | 1.30% | 2323 |
| 上海 | 100 | 810 | 1,700 | 2065 | ||
| 江苏 | 1,760 | 10,410 | 18,400 | 1973 | ||
| 浙江 | 120 | 1,600 | 3,300 | 2090 | ||
| 安徽 | 280 | 2,740 | 4,700 | 1809 | ||
| 福建 | 760 | 3,760 | 8,700 | 2639 | ||
| 江西 | 610 | 2,860 | 5,100 | 2028 | ||
| 山东 | 2,080 | 13,540 | 22,500 | 30 | 0.10% | 1863 |
| 河南 | 3,260 | 7,940 | 8,800 | 1480 | ||
| 湖北 | 740 | 4,050 | 7,400 | 1960 | ||
| 湖南 | 790 | 4,270 | 7,500 | 140 | 1.80% | 1960 |
| 广东 | 860 | 4,430 | 7,100 | 1612 | ||
| 广西 | 790 | 2,870 | 6,100 | 2385 | ||
| 海南 | -50 | 290 | 500 | 1645 | ||
| 重庆 | 140 | 640 | 1,100 | 1996 | ||
| 四川 | 720 | 3,250 | 7,100 | 2553 | ||
| 贵州 | 710 | 4,570 | 7,800 | 30 | 0.40% | 1861 |
| 云南 | 60 | 8,630 | 24,200 | 60 | 0.20% | 2808 |
| 西藏 | -2 | 8 | 20 | 2173 | ||
| 陕西 | 1,270 | 5,320 | 8,300 | 50 | 0.60% | 1931 |
| 甘肃 | 150 | 12,970 | 22,800 | 1,880 | 7.60% | 1787 |
| 青海 | 1,950 | 4,620 | 6,600 | 170 | 2.50% | 1743 |
| 宁夏 | 1,050 | 11,160 | 18,600 | 360 | 1.90% | 1811 |
| 新疆 | 350 | 19,560 | 41,300 | 6,610 | 14.00% | 2147 |
[newly added installations added by China Energy Portal, based on same stats for 2018]
备注:
1.容量单位:MW;电量单位:GWh;
2.并网容量、发电量、利用小时数来源于中电联;
3.弃风电量、弃风率来源于国家可再生能源中心、相关电网企业。数据为空白的表示不存在弃风现象。


