
All translations on this site are unofficial and provided for reference purpose only.
To view translations, select English under Step 1 (at the right of the screen). Not every item is (fully) translated. If you’re still seeing Chinese, you can use machine translation, under Step 2, to make sense of the rest.
Want to help translate? Switch to English under Step 1, and check ‘edit translation’ (more explanation in the FAQ). Even if you translate just a few lines, this is still very much appreciated! Remember to log in if you would like to be credited for your effort. If you’re unsure where to start translating, please see the list of Most wanted translations.
2019 Q2 wind power installations and production by province
Original title: 2019年上半年风电并网运行情况
Links: Original source (in Chinese) (link). Same statistics for Same stats for (2018) (2017) (2016).
2019 Q1&2 wind power installations and production by province
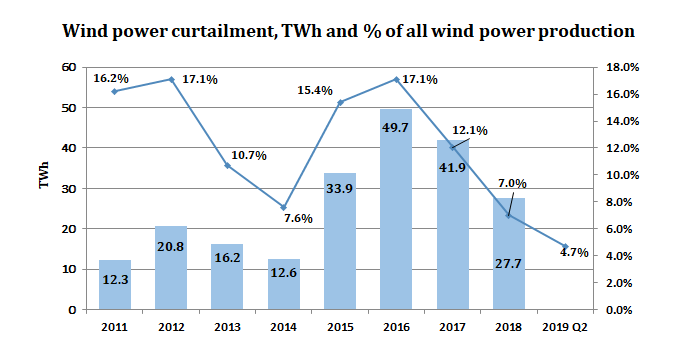
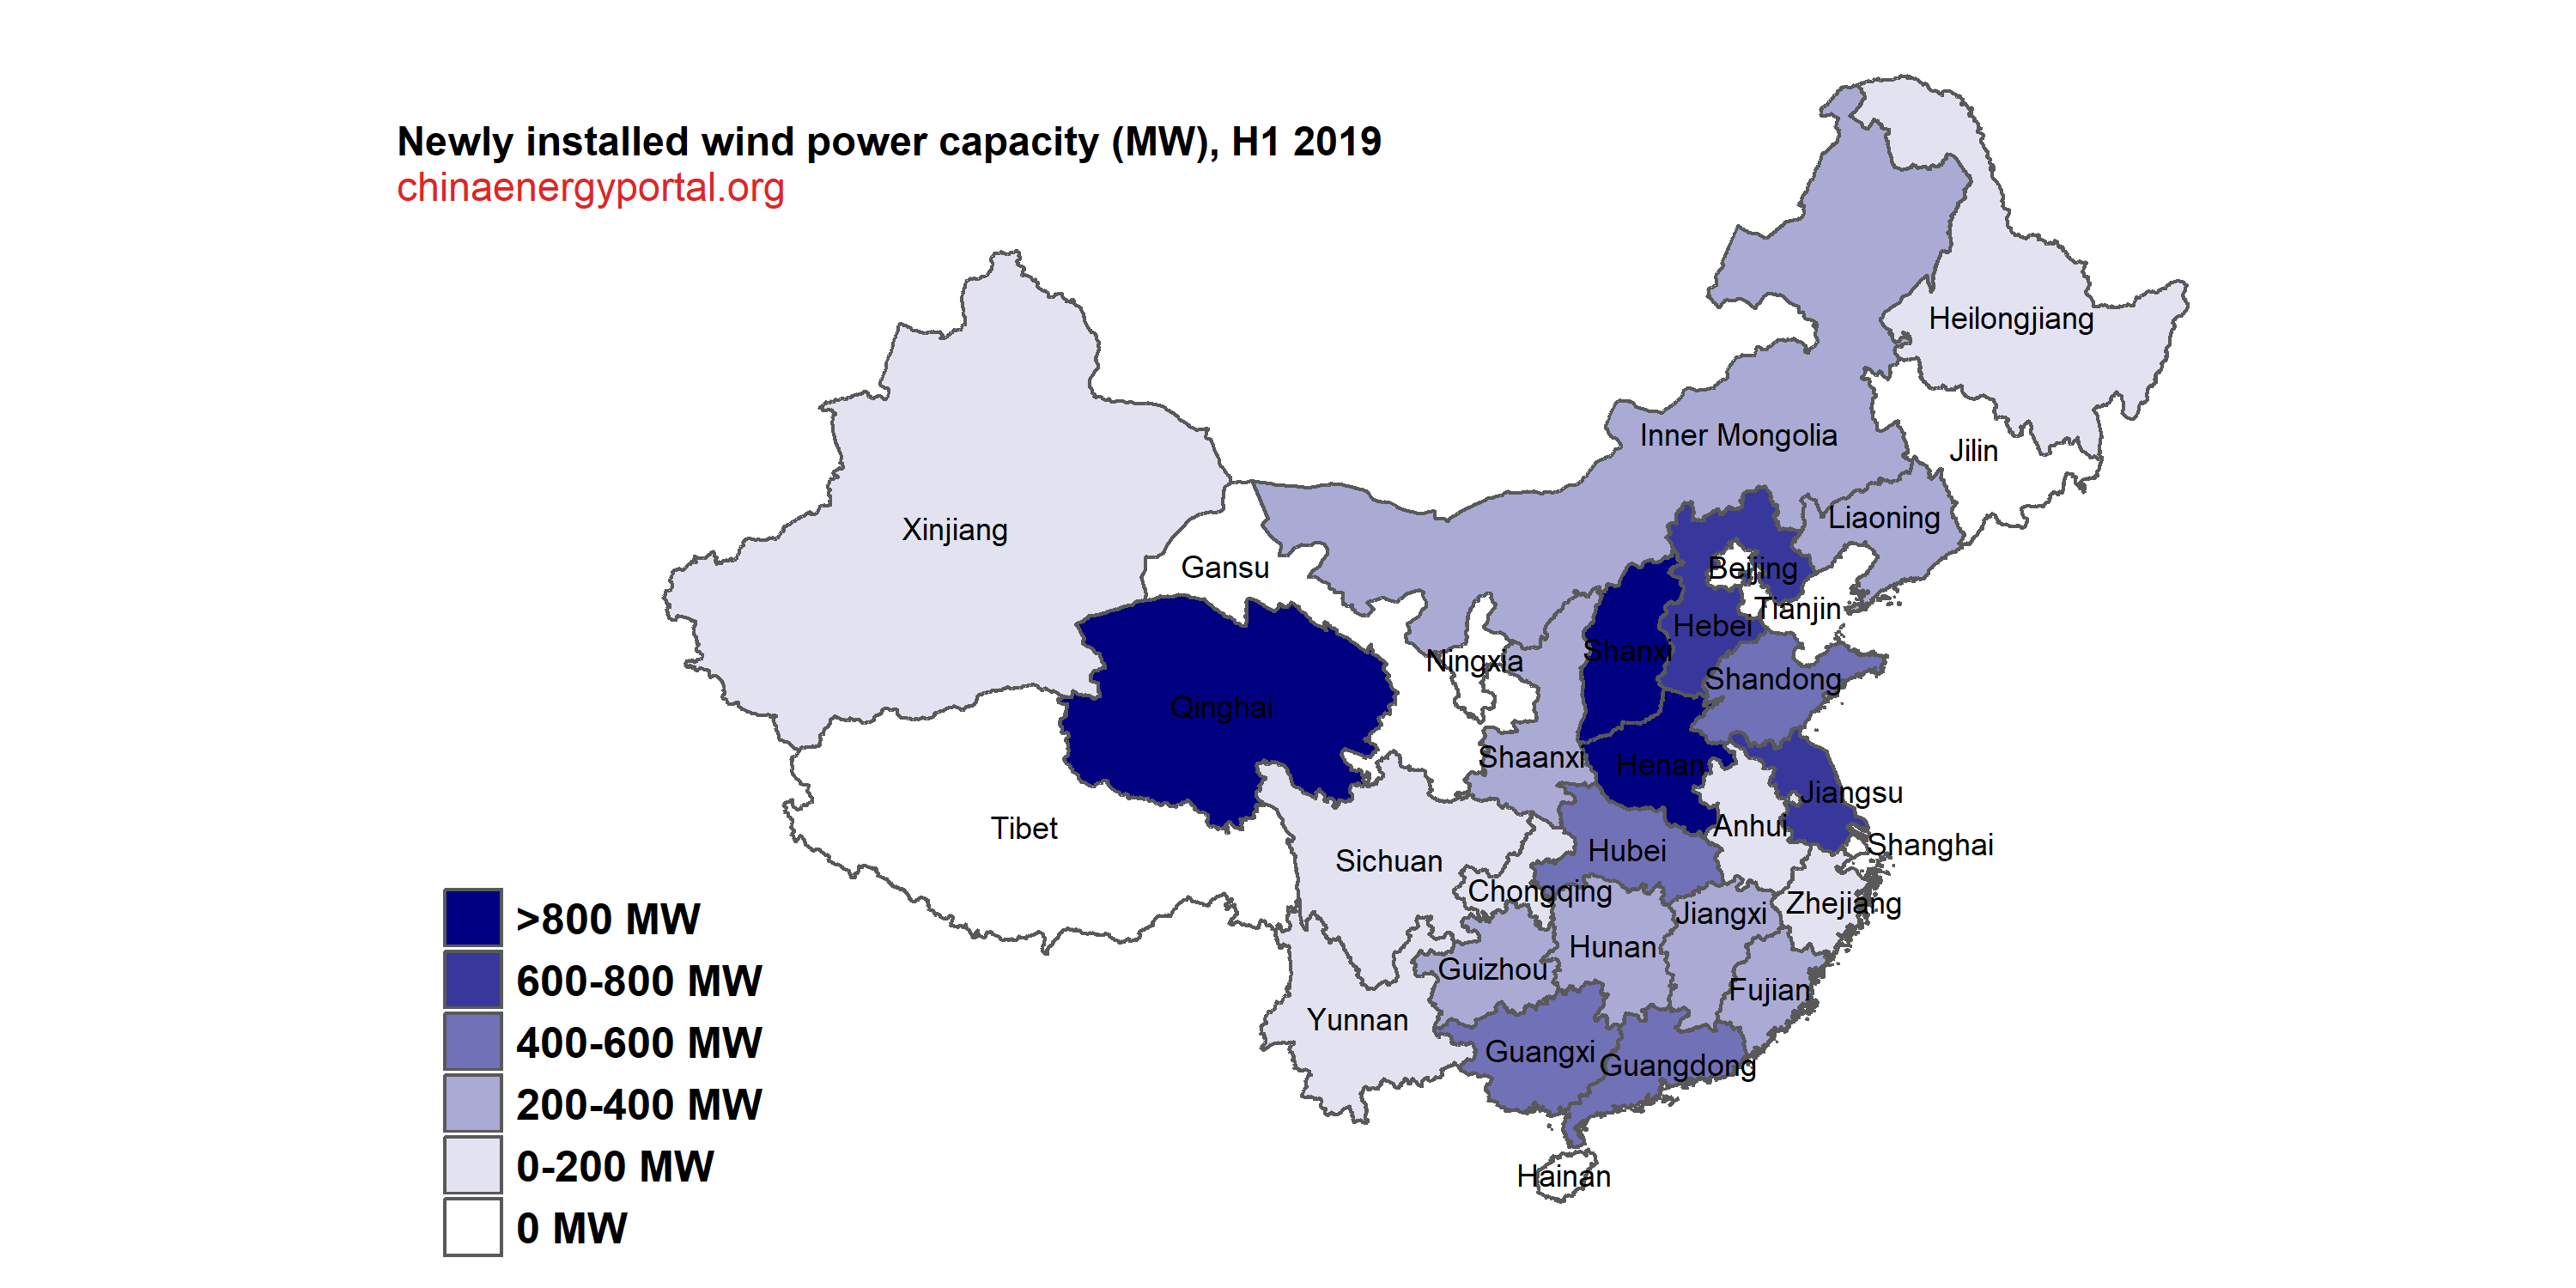
According to industry statistics, in the first six months of 2019, newly installed wind power capacity was 9.09 GW, of which 4 GW offshore wind power, with cumulative grid-connected capacity reaching 193 GW。In January to June 2019, nationwide wind power generation was 214.5 TWh, an increase of 11.5% on the same period last year;The national average productivity was 1133 full-load hours, down 10 from the same period last year。In January to June 2019, nationwide wind power curtailment was 10.5 TWh, down 7.7 TWh;The national average utilization rate of wind power was 95.3%, with an average rate of 4.7% curtailment, with curtailment down 4.0 percentage points from the same period last year。This continued a trend of a "double reduction" of curtailment and curtailment rate。
In January to June 2019, provinces with relatively high wind power productivity were Yunnan province (1843 full-load hours), and Sichuan (1654 hours)。
In January to June 2019, areas where wind power curtailment is still relatively severe were Xinjiang (curtailment rate of 17,0%, curtailment of 4.24 TWh), Gansu ( curtailment rate of 10.1%, or 1.33 TWh), and Inner Mongolia (curtailment rate of 8.2%, or 3.05 TWh)。
2019 Q1&2 wind power installations and production by province
| Province (autonomous region, municipality) | Newly installed grid-connected generation capacity (MW) | Cumulative grid-connected generation capacity (MW) | Electricity production (GWh) | Wind power curtailment (GWh) | Wind power curtailment (% of all) | Full-load hours |
| Total | 8,430 | 192,690 | 214,500 | 10,460 | 4.7% | 1133 |
| Beijing | 0 | 190 | 200 | 1093 | ||
| Tianjin | 0 | 520 | 660 | 1283 | ||
| Hebei | 740 | 14,650 | 17,030 | 740 | 4.2% | 1184 |
| Shanxi | 910 | 11,340 | 11,370 | 120 | 1.0% | 1031 |
| Inner Mongolia | 270 | 28,960 | 35,620 | 3,050 | 8.2% | 1236 |
| Liaoning | 280 | 7,890 | 10,480 | 60 | 0.6% | 1340 |
| Jilin | 0 | 5,140 | 6,470 | 220 | 3.3% | 1260 |
| Heilongjiang | 40 | 6,020 | 7,470 | 150 | 2.0% | 1243 |
| Shanghai | 0 | 710 | 790 | 990 | ||
| Jiangsu | 620 | 9,270 | 9,140 | 1037 | ||
| Zhejiang | 90 | 1,570 | 1,510 | 983 | ||
| Anhui | 120 | 2,580 | 2,260 | 890 | ||
| Fujian | 250 | 3,250 | 3,630 | 1162 | ||
| Jiangxi | 220 | 2,470 | 2,480 | 1037 | ||
| Shandong | 450 | 11,910 | 12,620 | 20 | 0.2% | 1084 |
| Henan | 940 | 5,620 | 4,260 | 795 | ||
| Hubei | 400 | 3,710 | 3,530 | 967 | ||
| Hunan | 330 | 3,810 | 3,770 | 110 | 290.0% | 1025 |
| Guangdong | 450 | 4,020 | 3,550 | 882 | ||
| Guangxi | 520 | 2,600 | 3,080 | 1298 | ||
| Hainan | -50 | 290 | 230 | 812 | ||
| Chongqing | 60 | 560 | 520 | 1017 | ||
| Sichuan | 110 | 2,640 | 4,440 | 1654 | ||
| Guizhou | 390 | 4,250 | 4,250 | 30 | 0.7% | 1067 |
| Yunnan | 60 | 8,630 | 15,900 | 50 | 0.3% | 1843 |
| Tibet | -2 | 8 | 10 | 1408 | ||
| Shaanxi | 350 | 4,400 | 3,430 | 40 | 1.1% | 967 |
| Gansu | 0 | 12,820 | 11,890 | 1,330 | 10.1% | 929 |
| Qinghai | 850 | 3,520 | 3,480 | 50 | 1.4% | 1027 |
| Ningxia | 0 | 10,110 | 9,040 | 230 | 2.4% | 894 |
| Xinjiang | 50 | 19,260 | 20,790 | 4,240 | 17.0% | 1094 |
Notes: 1. Unit of installed capacity:MW;Generation unit:GWh;
2.并网容量、发电量、利用小时数来源于中电联;
3.弃风电量、弃风率来源于国家可再生能源中心、相关电网企业。Blank cells indicates no curtailment occurred。
[newly added installations added by China Energy Portal, based on same stats for year-end 2018 (link)]


