
All translations on this site are unofficial and provided for reference purpose only.
To view translations, select English under Step 1 (at the right of the screen). Not every item is (fully) translated. If you’re still seeing Chinese, you can use machine translation, under Step 2, to make sense of the rest.
Want to help translate? Switch to English under Step 1, and check ‘edit translation’ (more explanation in the FAQ). Even if you translate just a few lines, this is still very much appreciated! Remember to log in if you would like to be credited for your effort. If you’re unsure where to start translating, please see the list of Most wanted translations.
2019 Q2 wind power installations and production by province
Original title: 2019年上半年风电并网运行情况
Links: Original source (in Chinese) (link). Same statistics for Same stats for (2018) (2017) (2016).
2019年上半年风电并网运行情况
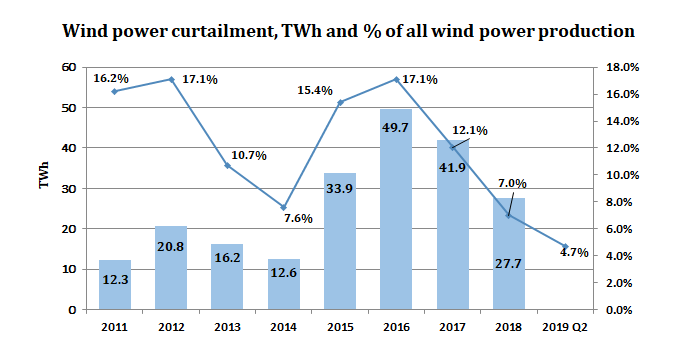
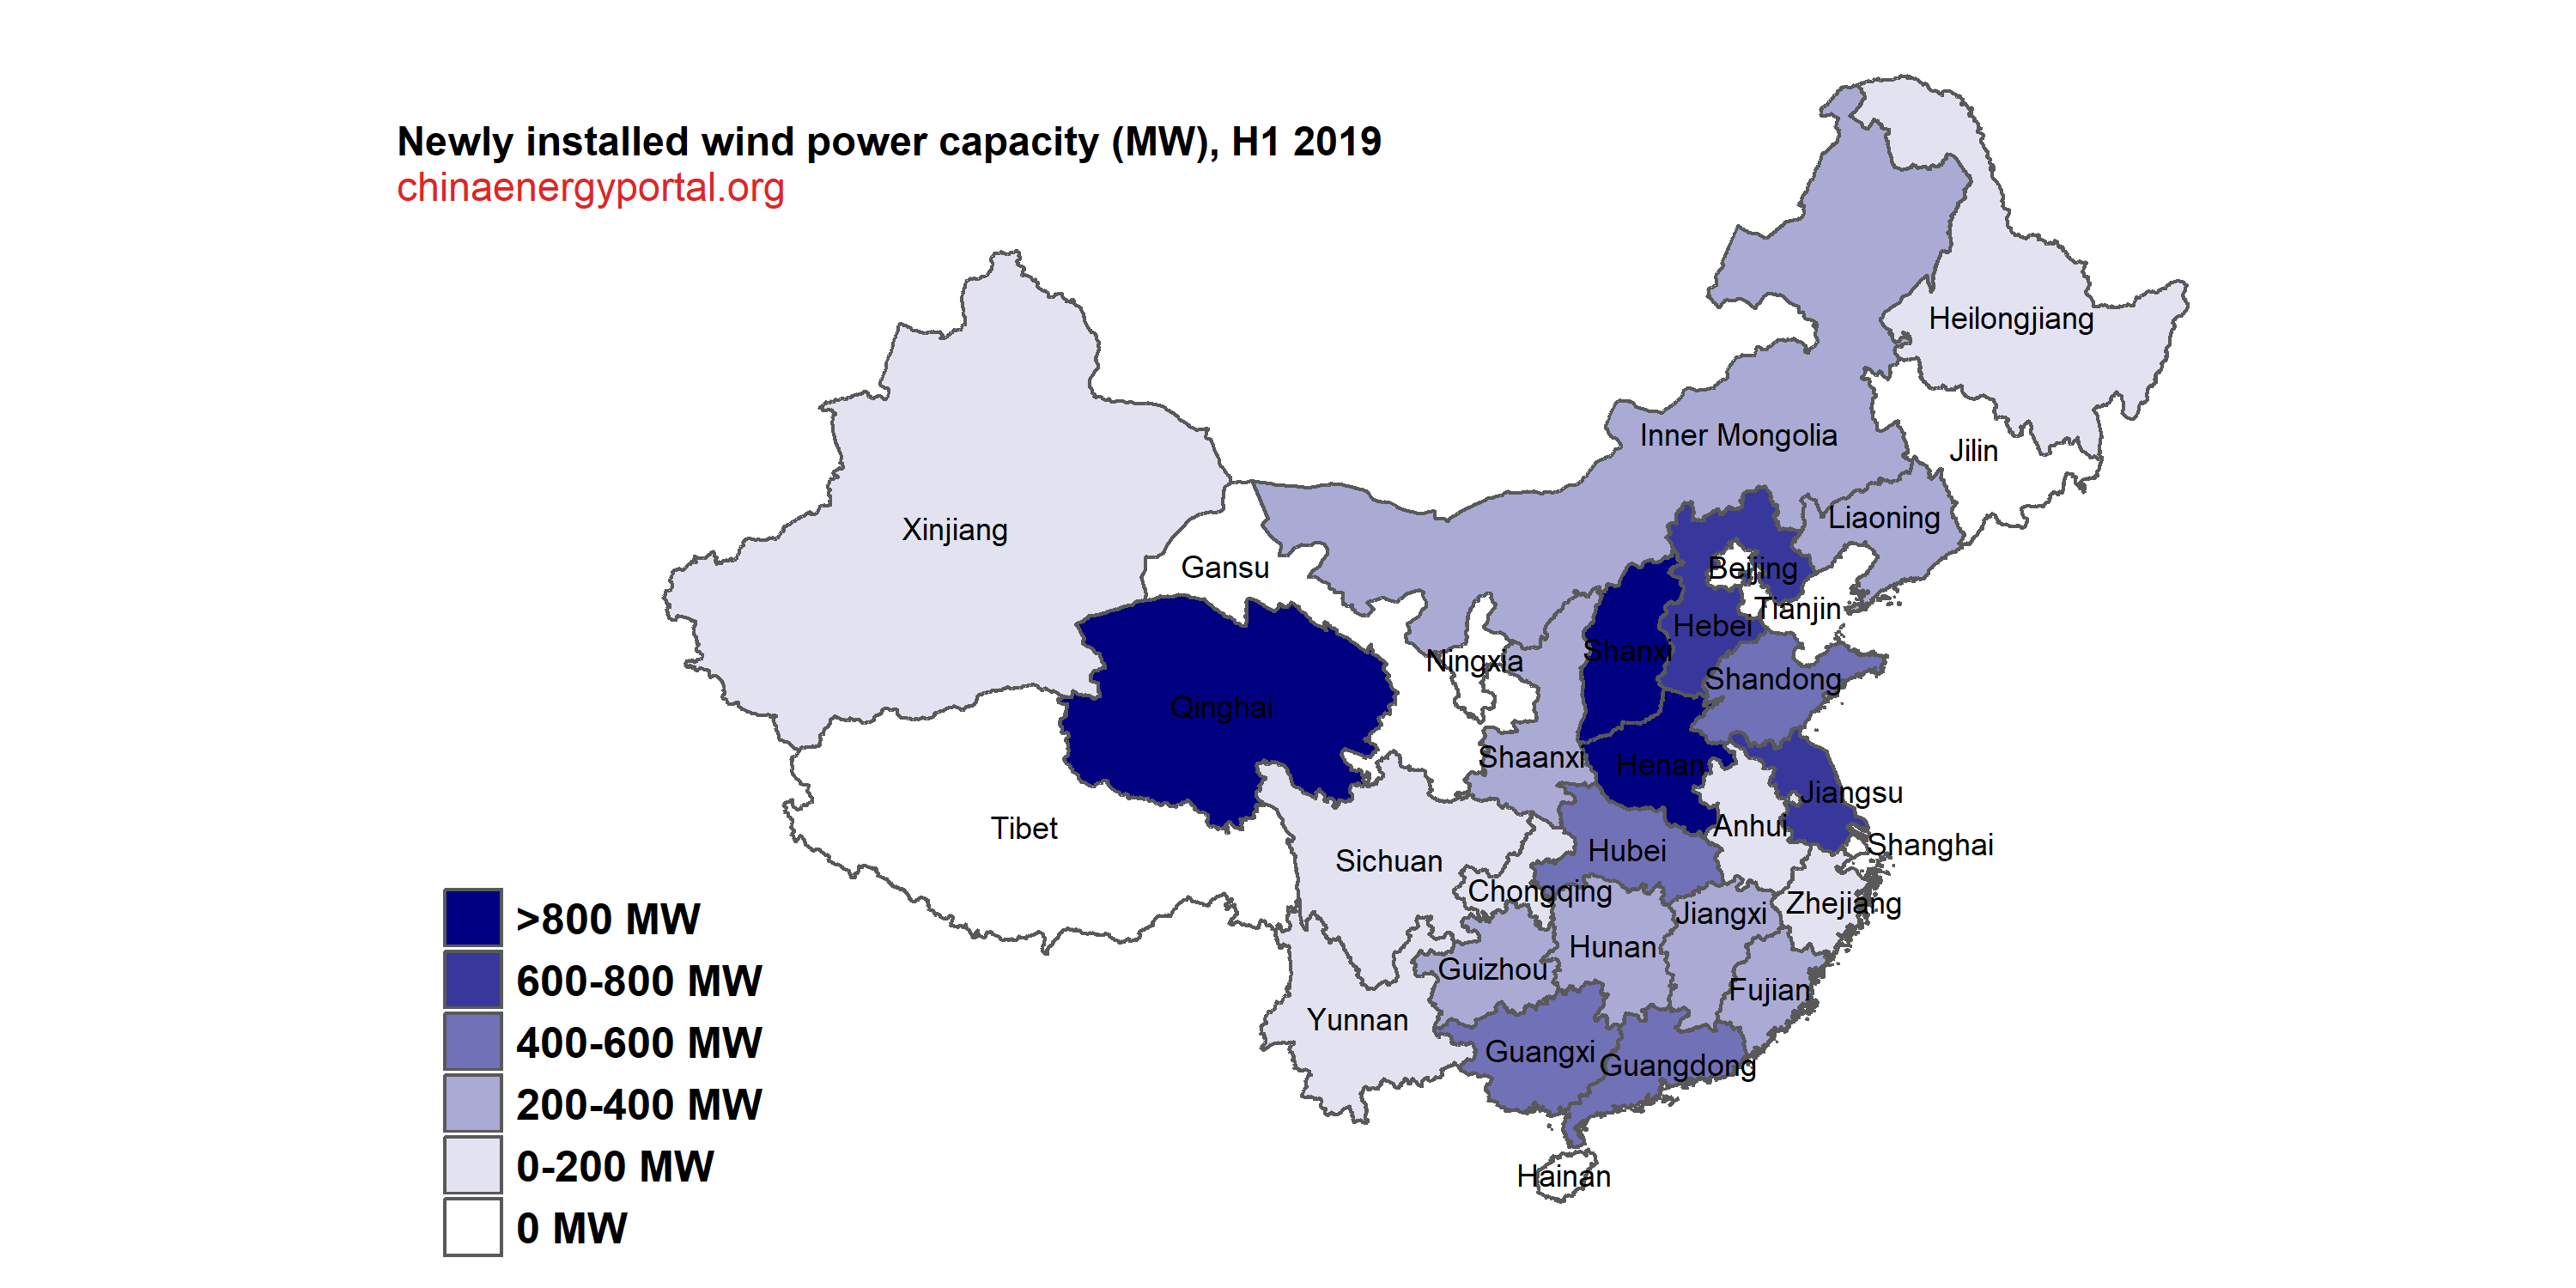
据行业统计,2019年1-6月,全国新增风电装机容量909万千瓦,其中海上风电40万千瓦,累计并网装机容量达到1.93亿千瓦。2019年1-6月,全国风电发电量2145亿千瓦时,同比增长11.5%;全国平均风电利用小时数1133小时,同比下降10小时。1-6月,全国弃风电量105亿千瓦时,同比减少77亿千瓦时;全国平均风电利用率95.3%,平均弃风率4.7%,弃风率同比下降4,0个百分点。全国弃风电量和弃风率持续“双降”。
2019年1-6月,平均利用小时数较高的省份是云南(1843小时)、四川(1654小时)。
2019年1-6月,弃风仍较为严重的地区是新疆(弃风率17,0%、弃风电量42.4亿千瓦时)、甘肃(弃风率10.1%、弃风电量13.3亿千瓦时)、内蒙古(弃风率8.2%、弃风电量30.5亿千瓦时)。
2019年上半年风电并网运行情况
| 省(区、市) | 新增并网容量 (MW) | 累计并网容量 (MW) | 发电量 (GWh) | 弃风电量 (GWh) | 弃风率 | 利用小时数 |
| 合 计 | 8,430 | 192,690 | 214,500 | 10,460 | 4.7% | 1133 |
| 北 京 | 0 | 190 | 200 | 1093 | ||
| 天 津 | 0 | 520 | 660 | 1283 | ||
| 河 北 | 740 | 14,650 | 17,030 | 740 | 4.2% | 1184 |
| 山 西 | 910 | 11,340 | 11,370 | 120 | 1.0% | 1031 |
| 内蒙古 | 270 | 28,960 | 35,620 | 3,050 | 8.2% | 1236 |
| 辽 宁 | 280 | 7,890 | 10,480 | 60 | 0.6% | 1340 |
| 吉 林 | 0 | 5,140 | 6,470 | 220 | 3.3% | 1260 |
| 黑龙江 | 40 | 6,020 | 7,470 | 150 | 2.0% | 1243 |
| 上 海 | 0 | 710 | 790 | 990 | ||
| 江 苏 | 620 | 9,270 | 9,140 | 1037 | ||
| 浙 江 | 90 | 1,570 | 1,510 | 983 | ||
| 安 徽 | 120 | 2,580 | 2,260 | 890 | ||
| 福 建 | 250 | 3,250 | 3,630 | 1162 | ||
| 江 西 | 220 | 2,470 | 2,480 | 1037 | ||
| 山 东 | 450 | 11,910 | 12,620 | 20 | 0.2% | 1084 |
| 河 南 | 940 | 5,620 | 4,260 | 795 | ||
| 湖 北 | 400 | 3,710 | 3,530 | 967 | ||
| 湖 南 | 330 | 3,810 | 3,770 | 110 | 290.0% | 1025 |
| 广 东 | 450 | 4,020 | 3,550 | 882 | ||
| 广 西 | 520 | 2,600 | 3,080 | 1298 | ||
| 海 南 | -50 | 290 | 230 | 812 | ||
| 重 庆 | 60 | 560 | 520 | 1017 | ||
| 四 川 | 110 | 2,640 | 4,440 | 1654 | ||
| 贵 州 | 390 | 4,250 | 4,250 | 30 | 0.7% | 1067 |
| 云 南 | 60 | 8,630 | 15,900 | 50 | 0.3% | 1843 |
| 西 藏 | -2 | 8 | 10 | 1408 | ||
| 陕 西 | 350 | 4,400 | 3,430 | 40 | 1.1% | 967 |
| 甘 肃 | 0 | 12,820 | 11,890 | 1,330 | 10.1% | 929 |
| 青 海 | 850 | 3,520 | 3,480 | 50 | 1.4% | 1027 |
| 宁 夏 | 0 | 10,110 | 9,040 | 230 | 2.4% | 894 |
| 新 疆 | 50 | 19,260 | 20,790 | 4,240 | 17.0% | 1094 |
备注: 1.容量单位:MW;电量单位:GWh;
2.并网容量、发电量、利用小时数来源于中电联;
3.弃风电量、弃风率来源于国家可再生能源中心、相关电网企业。数据为空白的表示不存在弃风现象。
[newly added installations added by China Energy Portal, based on same stats for year-end 2018 (link)]


