
All translations on this site are unofficial and provided for reference purpose only.
To view translations, select English under Step 1 (at the right of the screen). Not every item is (fully) translated. If you’re still seeing Chinese, you can use machine translation, under Step 2, to make sense of the rest.
Want to help translate? Switch to English under Step 1, and check ‘edit translation’ (more explanation in the FAQ). Even if you translate just a few lines, this is still very much appreciated! Remember to log in if you would like to be credited for your effort. If you’re unsure where to start translating, please see the list of Most wanted translations.
2020 Q2 wind power installations and production by province
Original title: 2020年上半年风电并网运行情况
Links: Original source (in Chinese) (link). Same statistics for Same stats for (2019) (2018) (2017) (2016).
2019 H1 wind power installations and production by province。
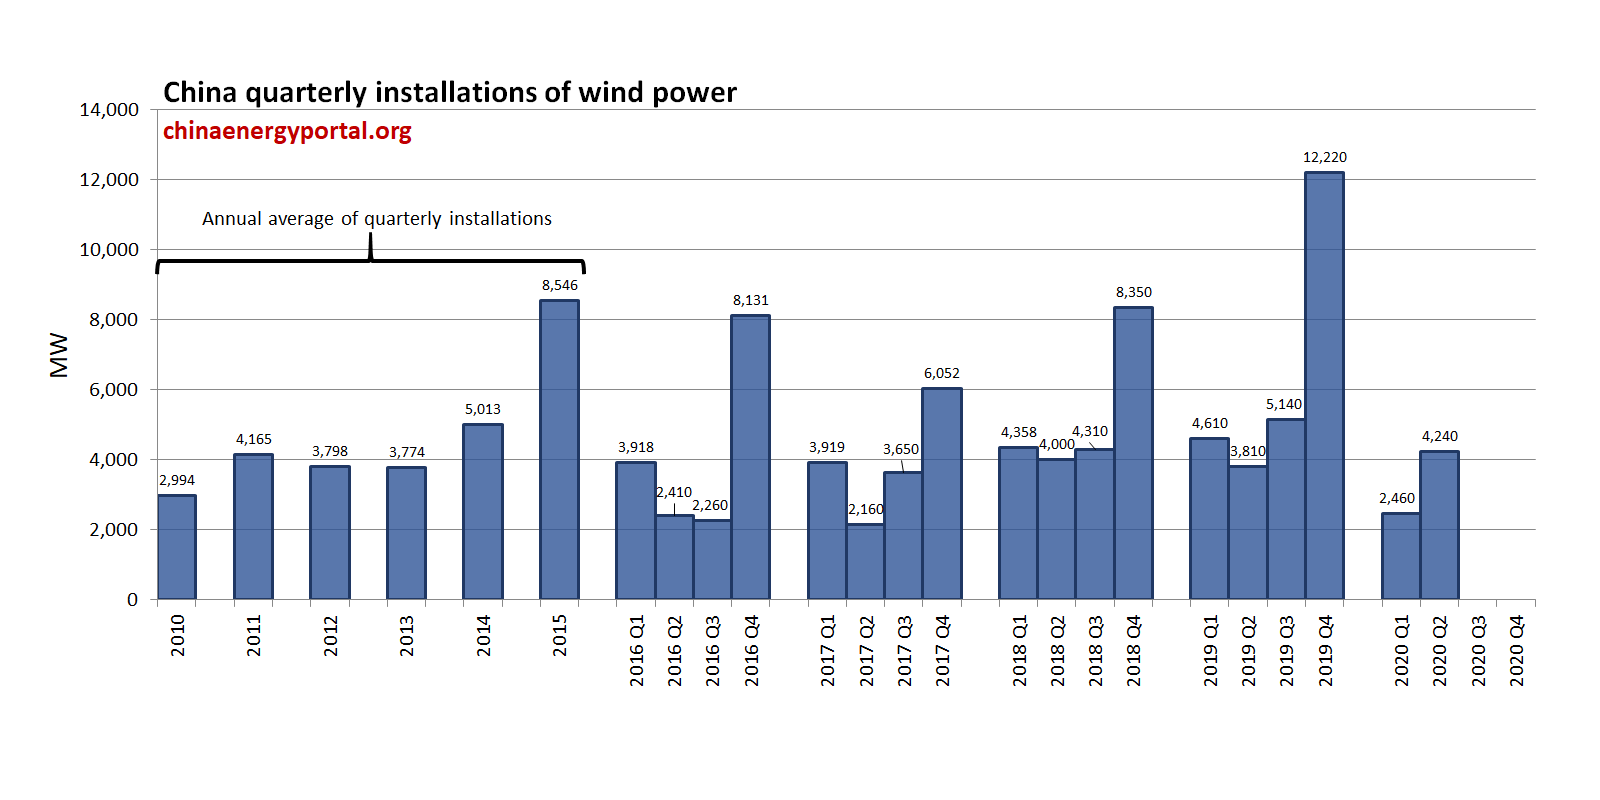
According to industry statistics, in the first half of 2020, China's newly installed wind power capacity was 6.32 GW, of which 5.26 onshore and 1.06 offshore wind power。By the end of June, cumulative installed wind power capacity 217 GW, including 210 GW onshore and 6.99 GW of offshore wind power。Newly installations were mainly concentrated in the five provinces of Shanxi, Hebei, Xinjiang, Shandong and Ningxia, with 710 MW, 650 MW, 500 MW, 490 MW and 400 MW respectively。
Wind power generation in the first half of the year was 237.9 TWh, a year-on-year increase of 10.9%;Average productivity of wind power nationwide was 1123 full-load hours. Areas with relatively high productivity were Yunnan (1736 hours), Sichuan (1488 hours) and Guangxi (1414 hours)。
2019 H1 wind power installations and production by province
| Province (autonomous region, municipality) | Newly installed grid-connected generation capacity (MW) | Cumulative grid-connected generation capacity (MW) | Electricity production (GWh) | Full-load hours |
| National | 6,700 | 216,750 | 237,900 | 1123 |
| Beijing | 0 | 190 | 200 | 1082 |
| Tianjin | 10 | 610 | 660 | 1102 |
| Hebei | 260 | 16,650 | 19,100 | 1158 |
| Shanxi | 630 | 13,140 | 12,880 | 998 |
| Inner Mongolia | 260 | 30,330 | 36,040 | 1232 |
| Liaoning | 240 | 8,560 | 10,770 | 1278 |
| Jilin | 0 | 5,570 | 6,670 | 1196 |
| Heilongjiang | 50 | 6,160 | 6,860 | 1120 |
| Shanghai | 0 | 810 | 980 | 1185 |
| Jiangsu | 690 | 11,100 | 12,670 | 1188 |
| Zhejiang | 130 | 1,730 | 1,620 | 983 |
| Anhui | 130 | 2,870 | 3,000 | 1050 |
| Fujian | 340 | 4,100 | 4,690 | 1180 |
| Jiangxi | 190 | 3,050 | 3,350 | 1159 |
| Shandong | 500 | 14,040 | 14,900 | 1093 |
| Henan | 300 | 8,240 | 7,210 | 893 |
| Hubei | 140 | 4,190 | 4,130 | 998 |
| Hunan | 400 | 4,670 | 4,540 | 1029 |
| Guangdong | 350 | 4,780 | 4,390 | 919 |
| Guangxi | 580 | 3,450 | 4,690 | 1414 |
| Hainan | 0 | 290 | 260 | 882 |
| Chongqing | 0 | 640 | 570 | 907 |
| Sichuan | 20 | 3,270 | 4,850 | 1488 |
| Guizhou | 140 | 4,710 | 5,100 | 1130 |
| Yunnan | 150 | 8,780 | 15,240 | 1736 |
| Tibet | 2 | 10 | 10 | 1054 |
| Shaanxi | 100 | 5,420 | 4,850 | 1005 |
| Gansu | 150 | 13,120 | 13,010 | 1007 |
| Qinghai | 250 | 4,870 | 3,870 | 802 |
| Ningxia | 400 | 11,560 | 9,700 | 857 |
| Xinjiang | 300 | 19,860 | 21,100 | 1069 |
[newly added installations added by China Energy Portal, based on same stats for year-end 2019 (link)]
Notes: 1. Unit of installed capacity:MW;Generation unit:GWh;
2. Data source:CEC。


