
All translations on this site are unofficial and provided for reference purpose only.
To view translations, select English under Step 1 (at the right of the screen). Not every item is (fully) translated. If you’re still seeing Chinese, you can use machine translation, under Step 2, to make sense of the rest.
Want to help translate? Switch to English under Step 1, and check ‘edit translation’ (more explanation in the FAQ). Even if you translate just a few lines, this is still very much appreciated! Remember to log in if you would like to be credited for your effort. If you’re unsure where to start translating, please see the list of Most wanted translations.
2017 electricity & other energy statistics (update of June 2018)
Original title: 2017年全国电力工业统计快报数据一览表
Links: Source document (in Chinese) (link). Same statistics for (2018) (2017) (2016) (2015) (2014) (2013) (2012) (2011) (2010) (2009) (2008) (2007) (2006).
Note: an updated and more detailed version of the 2017 statistics is available here: (link).
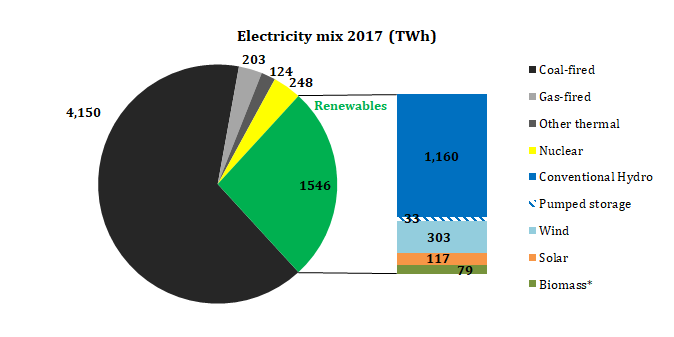
[*: In these graphs, biomass power production has been subtracted from values reported for ‘Thermal’ by the CEC (in the statistical bulletin below). Data on biomass production is from the NEA (link)]
Basic electric power statistics 2017
| Unit | 2016 | 2017 | YoY growth (±,%) | |||
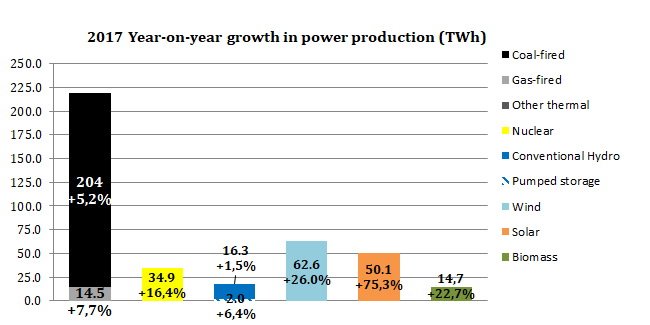
| 1, Electric power production | GWh | 6,022,845 | 6,417,109 | 6.55 | ||
| Hydro power | GWh | 1,174,837 | 1,193,062 | 1.55 | ||
| Of which:Pumped storage | GWh | 30,781 | 32,753 | 6.41 | ||
| Thermal power | GWh | 4,327,317 | 4,555,760 | 5.28 | ||
| Of which:Coal fired | GWh | 3,945,678 | 4,149,763 | 5.17 | ||
| Gas | GWh | 188,280 | 202,760 | 7.69 | ||
| Nuclear power | GWh | 213,178 | 248,125 | 16.39 | ||
| Wind power | GWh | 240,861 | 303,420 | 25.97 | ||
| Solar power | GWh | 66,528 | 116,618 | 75.29 | ||
| 2. Total power consumption | GWh | 5,971,010 | 6,362,512 | 6.56 | ||
| A. Industrial power consumption | GWh | 5,163,311 | 5,492,258 | 6.37 | ||
| Primary industry | GWh | 109,324 | 117,512 | 7.49 | ||
| Secondary industry | GWh | 4,256,682 | 4,492,224 | 5.53 | ||
| Of which: industry | GWh | 4,183,983 | 4,413,302 | 5.48 | ||
| — Of which:Light industry | GWh | 704,595 | 752,630 | 6.82 | ||
| — Heavy industry | GWh | 3,479,388 | 3,660,671 | 5.21 | ||
| Tertiary industry | GWh | 797,306 | 882,522 | 10.69 | ||
| B. Residential electricity consumption | GWh | 807,699 | 870,254 | 7.74 | ||
| Urban residents | GWh | 457,143 | 496,181 | 8.54 | ||
| Rural residents | GWh | 350,555 | 374,073 | 6.71 | ||
| 3. Installed power generation capacity | MW | 1,650,507 | 1,777,085 | 7.67 | ||
| Hydro power | MW | 332,070 | 343,587 | 3.47 | ||
| Of which:Pumped storage | MW | 26,693 | 28,693 | 7.49 | ||
| Thermal power | MW | 1,060,944 | 1,104,946 | 4.15 | ||
| Of which:Coal fired | MW | 946,244 | 981,300 | 3.70 | ||
| Gas | MW | 70,105 | 75,697 | 7.98 | ||
| Nuclear power | MW | 33,642 | 35,817 | 6.47 | ||
| Wind power | MW | 147,471 | 163,252 | 10.70 | ||
| Solar power | MW | 76,313 | 129,415 | 69.59 | ||
| 4. 35 kV and above transmission line length | km | 1,756,141 | 1,825,611 | 3.96 | ||
| 1. Alternating current | km | 1,727,333 | 1,788,212 | 3.52 | ||
| Of which: 1000 kV | km | 7,245 | 10,073 | 39.04 | ||
| 750 kV | km | 17,968 | 18,830 | 4.80 | ||
| 500 kV | km | 165,875 | 173,772 | 4.76 | ||
| 330 kV | km | 28,366 | 30,183 | 6.41 | ||
| 220 kV | km | 397,050 | 415,311 | 4.60 | ||
| 110 kV | km | 611,431 | 631,361 | 3.26 | ||
| 35 kV | km | 499,400 | 508,682 | 1.86 | ||
| 2. Direct current | km | 28,808 | 37,399 | 29.82 | ||
| Of which:±800 kV | km | 12,295 | 20,874 | 69.77 | ||
| ±660 kV | km | 1,334 | 1,334 | |||
| ±500 kV | km | 13,539 | 13,552 | 0.09 | ||
| ±400 kV | km | 1,640 | 1,640 | |||
| 5. 35 kV and above substation capacity | MVA | 6,299,820 | 6,631,078 | 5.3 | ||
| 1. Alternating current | MVA | 6,062,361 | 6,300,653 | 3.9 | ||
| Of which: 1000 kV | MVA | 99,000 | 138,000 | 39.4 | ||
| 750 kV | MVA | 135,704 | 145,404 | 7.1 | ||
| 500 kV | MVA | 1,171,276 | 1,255,082 | 7.2 | ||
| 330 kV | MVA | 113,196 | 126,134 | 11.4 | ||
| 220 kV | MVA | 1,935,995 | 2,031,586 | 4.9 | ||
| 110 kV | MVA | 2,074,255 | 2,098,015 | 1.1 | ||
| 35 kV | MVA | 532,935 | 506,432 | -5.0 | ||
| 2. Direct current | MVA | 237,459 | 330,425 | 39.2 | ||
| Of which:±800 kV | MVA | 48,823 | 106,959 | 119.1 | ||
| ±660 kV | MVA | 4,836 | 4,836 | |||
| ±500 kV | MVA | 175,670 | 188,307 | 7.2 | ||
| ±400 kV | MVA | |||||
| 6. Newly installed generation capacity | MW | 121,431 | 131,185 | 8.03 | ||
| Hydro power | MW | 11,791 | 12,875 | 9.20 | ||
| Of which:Pumped storage | MW | 3,660 | 2,000 | -45.36 | ||
| Thermal power | MW | 50,483 | 44,534 | -11.78 | ||
| Of which:Coal fired | MW | 38,656 | 35,043 | -9.35 | ||
| Gas | MW | 2,142 | 5,707 | 166.38 | ||
| Nuclear power | MW | 7,205 | 2,175 | -69.81 | ||
| Wind power | MW | 20,243 | 18,193 | -10.13 | ||
| Solar power | MW | 31,710 | 53,407 | 68.42 | ||
| 7. Retired and closed down thermal power capacity | MW | 5,714 | 9,293 | 62.64 | ||
| 8. Power generation projects under construction (at year end) by main power companies | MW | 207,570 | 208,038 | 0.23 | ||
| Hydro power | MW | 74,326 | 78,866 | 6.11 | ||
| Thermal power | MW | 91,286 | 86,368 | -5.39 | ||
| Nuclear power | MW | 24,468 | 22,893 | -6.44 | ||
| Wind power | MW | 15,966 | 19,086 | 19.55 | ||
| 9. New DC transmission line and AC converter capacity | ||||||
| 1. Line length | km | 3,391 | 8,339 | 145.91 | ||
| Of which: ±800 kV | km | 1,720 | 8,339 | 384.81 | ||
| ±660 kV | km | |||||
| ±500 kV | km | 1,671 | 0 | -100.00 | ||
| ±400 kV | km | |||||
| 2. AC capacity | MW | 32,400 | 79,000 | 143.83 | ||
| Of which: ±800 kV | MW | 16,000 | 77,000 | 381.25 | ||
| ±660 kV | MW | |||||
| ±500 kV | MW | 16,400 | 2,000 | -87.80 | ||
| ±400 kV | MW | |||||
| 10. New 110 kV and above AC transmission line length and substation capacity | ||||||
| 1. Line length | km | 56,679 | 58,084 | 2.48 | ||
| Of which: 1000 kV | km | 4,252 | 2,846 | -33.07 | ||
| 750 kV | km | 1,813 | 899 | -50.42 | ||
| 500 kV | km | 6,931 | 7,999 | 15.42 | ||
| 330 kV | km | 1,525 | 2,521 | 65.26 | ||
| 220 kV | km | 17,088 | 18,810 | 10.08 | ||
| 110 kV (including 66 kV) | km | 25,070 | 25,010 | -0.24 | ||
| 2. Substation capacity | MVA | 345,847 | 325,946 | -5.75 | ||
| Of which: 1000 kV | MVA | 51,000 | 30,000 | -41.18 | ||
| 750 kV | MVA | 18,600 | 17,400 | -6.45 | ||
| 500 kV | MVA | 77,150 | 82,750 | 7.26 | ||
| 330 kV | MVA | 4,800 | 7,830 | 63.13 | ||
| 220 kV | MVA | 92,390 | 104,328 | 12.92 | ||
| 110 kV (including 66 kV) | MVA | 101,907 | 83,638 | -17.93 | ||
| 11. Completed investment by main power companies | Million RMB | 883,986 | 823,872 | -6.80 | ||
| 1. Power plant investment | Million RMB | 340,837 | 289,984 | -14.92 | ||
| Hydro power | Million RMB | 61,714 | 62,162 | 0.73 | ||
| Thermal power | Million RMB | 111,928 | 85,771 | -23.37 | ||
| Nuclear power | Million RMB | 50,407 | 45,422 | -9.89 | ||
| Wind power | Million RMB | 92,666 | 68,107 | -26.50 | ||
| Solar power | Million RMB | 24,123 | 28,522 | 18.24 | ||
| 2. Electric grid investment | Million RMB | 543,149 | 533,888 | -1.70 | ||
| Transmission and distribution | Million RMB | 528,151 | 513,518 | -2.77 | ||
| Of which:Direct current | Million RMB | 49,475 | 85,893 | 73.61 | ||
| Alternating current | Million RMB | 478,675 | 427,624 | -10.67 | ||
| Other | Million RMB | 14,998 | 20,371 | 35.82 | ||
| 12. Unit capacity in multi-generator power plants, of capacity of 6 MW and above | ||||||
| Hydro power | MW/unit | 64.15 | 60.74 | -0.34 | ||
| Thermal power | MW/unit | 131.94 | 131.48 | -0.05 | ||
| 13. Coal consumption, net, (as standard coal equivalent) in power plants 6 MW and above | g/kWh | 312.08 | 309.43 | -2.65 | ||
| 14. Power plant own consumption, plants 6 MW and above | % | 4.77 | 4.80 | 0.03 | ||
| Hydro power | % | 0.29 | 0.27 | -0.02 | ||
| Thermal power | % | 6.01 | 6.04 | 0.03 | ||
| 15. Power plant productivity (full load hours), power plants 6 MW and above | hours | 3,797 | 3,790 | -7 | ||
| Hydro power | hours | 3,619 | 3,597 | -22 | ||
| Of which:Pumped storage | hours | 1,266 | 1,176 | -90 | ||
| Thermal power | hours | 4,186 | 4,219 | 33 | ||
| Nuclear power | hours | 7,060 | 7,089 | 28 | ||
| Wind power | hours | 1,745 | 1,949 | 204 | ||
| Solar power | hours | 1,129 | 1,205 | 76 | ||
| 16. Electricity supply, consumption, and transmission losses | ||||||
| Electricity supply | GWh | 5,074,245 | 5,435,651 | 7.12 | ||
| Electricity consumption | GWh | 4,745,125 | 5,083,491 | 7.13 | ||
| Transmission losses | GWh | 329,120 | 352,161 | 7.00 | ||
| Transmission loss rate | % | 6.49 | 6.48 | -0.01 | ||
Additional statistics from NBS:
Original title: 2017年12月份规模以上工业增加值增长6.2%
Links: Source document (in Chinese) (link).
December 2017 Key industrial production data (large scale industry)
| January-December | |||
| Amount | YoY Increase | ||
| (%) | |||
| Vehicles | 1000 units | 29,942 | 3.2 |
| Of which:Sedan | 1000 units | 11,990 | -0.8 |
| Sport utility vehicles (SUV) | 1000 units | 10,334 | 9.1 |
| Of which:“New Energy Vehicles" | 1000 units | 716 | 51.1 |
| Generators (power generation equipment) | MW | 118,330 | -7.3 |
| Raw coal | kt | 3,445,460 | 3.2 |
| Coking coal | kt | 431,430 | -3.3 |
| Crude oil | kt | 191,510 | -4 |
| Crude oil processing capacity | kt | 567,770 | 5 |
| Natural gas | Million cubic meter | 147,400 | 8.5 |


