
All translations on this site are unofficial and provided for reference purpose only.
To view translations, select English under Step 1 (at the right of the screen). Not every item is (fully) translated. If you’re still seeing Chinese, you can use machine translation, under Step 2, to make sense of the rest.
Want to help translate? Switch to English under Step 1, and check ‘edit translation’ (more explanation in the FAQ). Even if you translate just a few lines, this is still very much appreciated! Remember to log in if you would like to be credited for your effort. If you’re unsure where to start translating, please see the list of Most wanted translations.
2019 detailed electricity statistics (update of Jan 2021)
Original title: 2019年全国电力工业统计快报数据一览表
Links: Source document (in Chinese) (link). Same statistics for (2020) (2019) (2018) (2017) (2016) (2015) (2014) (2013) (2012) (2011) (2010) (2009) (2008) (2007) (2006).
[Biomass includes power generation based on crop stalks, bagasse, and forestry residue, as well as waste incineration, see details below]
1-1 2019年国民经济主要指标一览
| Unit | 2019 | YoY increase (%) | ||
| Population | Population (million) | 1,400.05 | 0.3 | |
| Urban population | Population (million) | 848.43 | 2.1 | |
| Rural population | Population (million) | 551.62 | -2.2 | |
| GDP | Million RMB | 99,086,500 | 10.1 | |
| Primary industry | Million RMB | 7,046,700 | 8.9 | |
| Secondary industry | Million RMB | 38,616,500 | 5.5 | |
| Tertiary industry | Million RMB | 53,423,300 | 13.8 | |
| Total fixed asset investment | Million RMB | 56,087,400 | -13.1 | |
| Total imports and exports | Million US$ | 4,576,100 | -1 | |
| Exports | Million US$ | 2,499,000 | 0.5 | |
| Imports | Million US$ | 2,077,100 | -2.7 | |
| Total energy production (as Mtce) | Mt | 3970 | 5.3 | |
| Raw coal (Mtce) | Mt | 2720 | 4.3 | |
| Crude oil (Mtce) | Mt | 270 | 0.4 | |
| Natural gas (Mtce) | Mt | 230 | 7.8 | |
| Total energy consumption (Mtce) | Mt | 4860 | 4.7 | |
| Raw coal (Mtce) | Mt | 2800 | 2.3 | |
| Oil (Mtce) | Mt | 920 | 4.4 | |
| Natural gas (Mtce) | Mt | 390 | 9.3 | |
1-2 Basic electric power statistics
| Unit | 2018 | 2019 | YoY increase (%) | |||
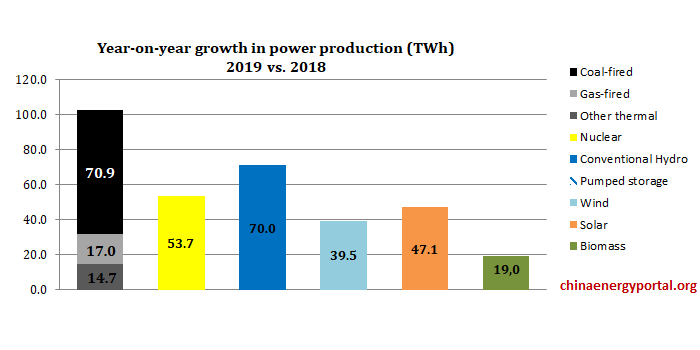
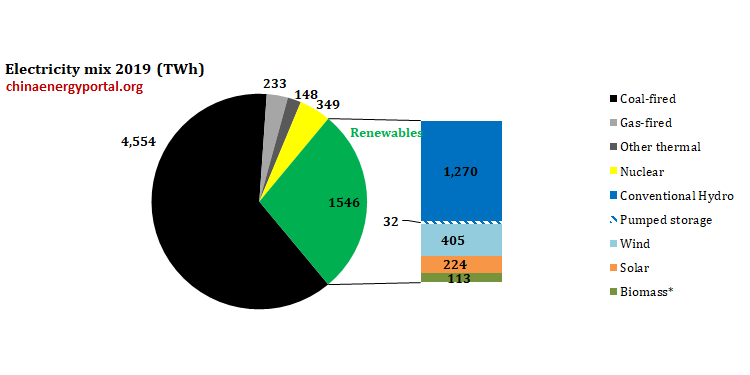
| 1. Electric power production | GWh | 6,994,700 | 7,326,900 | 4.75 | ||
| Hydro power | GWh | 1,232,100 | 1,302,100 | 5.68 | ||
| Of which:Pumped storage | GWh | 32,900 | 31,900 | -2.96 | ||
| Thermal power | GWh | 4,924,900 | 5,046,500 | 2.47 | ||
| Of which:Coal fired | GWh | 4,482,900 | 4,553,800 | 1.58 | ||
| Gas | GWh | 215,500 | 232,500 | 7.89 | ||
| Oil | GWh | 1,500 | 1,300 | -15.72 | ||
| Nuclear power | GWh | 295,000 | 348,700 | 18.23 | ||
| Wind power | GWh | 365,800 | 405,300 | 10.82 | ||
| Solar power | GWh | 176,900 | 224,000 | 26.60 | ||
| Other | GWh | 100 | 300 | 169.00 | ||
| 非化石能源发电量 | GWh | 2,163,400 | 2,393,000 | 10.61 | ||
| Hydro power | GWh | 1,232,100 | 1,302,100 | 5.68 | ||
| Biomass power generation | GWh | 93,600 | 112,600 | 20.28 | ||
| Nuclear power | GWh | 295,000 | 348,700 | 18.23 | ||
| Wind power | GWh | 365,800 | 405,300 | 10.82 | ||
| Solar power | GWh | 176,900 | 224,000 | 26.60 | ||
| Other | GWh | 100 | 300 | 169.00 | ||
| Generation by thermal power plants 6 MW and above | GWh | 4,916,700 | 5,037,600 | 2.46 | ||
| Coal fired | GWh | 4,482,100 | 4,553,000 | 1.58 | ||
| Of which:Coal gangue power generation | GWh | 128,600 | 151,000 | 17.39 | ||
| Gas-fired | GWh | 213,400 | 229,800 | 7.73 | ||
| Of which:Conventional gas | GWh | 205,300 | 221,400 | 7.82 | ||
| Coal bed methane power generation | GWh | 7,000 | 7,200 | 1.66 | ||
| Oil-fired | GWh | 1,500 | 1,300 | -15.81 | ||
| Other | GWh | 219,800 | 253,500 | 15.35 | ||
| Of which:Waste heat, waste gas, waste pressure power generation | GWh | 129,000 | 144,700 | 12.18 | ||
| Waste incineration power generation | GWh | 48,100 | 60,700 | 26.15 | ||
| Crop stalk, bagasse, and forestry residue based power generation | GWh | 42,700 | 48,100 | 12.74 | ||
| 2. Total power consumption | GWh | 6,940,400 | 7,248,600 | 4.44 | ||
| A. Industrial power consumption | GWh | 5,970,800 | 6,223,600 | 4.23 | ||
| Primary industry | GWh | 74,700 | 77,900 | 4.42 | ||
| Secondary industry | GWh | 4,812,300 | 4,959,500 | 3.06 | ||
| —Of which: industry | GWh | 4,734,300 | 4,870,500 | 2.88 | ||
| Tertiary industry | GWh | 1,083,900 | 1,186,100 | 9.44 | ||
| B. Residential electricity consumption | GWh | 969,700 | 1,025,000 | 5.70 | ||
| Urban residents | GWh | 553,300 | 583,800 | 5.52 | ||
| Rural residents | GWh | 416,400 | 441,200 | 5.96 | ||
| 3. Installed power generation capacity | MW | 1,900,120 | 2,010,060 | 5.79 | ||
| Hydro power | MW | 352,590 | 358,040 | 1.55 | ||
| Of which:Pumped storage | MW | 29,990 | 30,290 | 1.00 | ||
| Thermal power | MW | 1,144,080 | 1,189,570 | 3.98 | ||
| Of which:Coal fired | MW | 1,008,350 | 1,040,630 | 3.20 | ||
| Gas | MW | 83,750 | 90,240 | 7.74 | ||
| Oil | MW | 1,730 | 1,750 | 0.72 | ||
| Nuclear power | MW | 44,660 | 48,740 | 9.15 | ||
| Wind power | MW | 184,270 | 209,150 | 13.51 | ||
| Solar power | MW | 174,330 | 204,180 | 17.12 | ||
| Other | MW | 200 | 370 | 84.21 | ||
| 非化石能源发电装机容量 | MW | 775,510 | 844,100 | 8.84 | ||
| Hydro power | MW | 352,590 | 358,040 | 1.55 | ||
| Biomass power generation | MW | 19,470 | 23,610 | 21.27 | ||
| Nuclear power | MW | 44,660 | 48,740 | 9.15 | ||
| Wind power | MW | 184,270 | 209,150 | 13.51 | ||
| Solar power | MW | 174,330 | 204,180 | 17.12 | ||
| Other | MW | 200 | 370 | 84.21 | ||
| Generation capacity of thermal power plants 6 MW and above | MW | 1,141,000 | 1,186,420 | 3.98 | ||
| Coal fired | MW | 1,007,940 | 1,040,280 | 3.21 | ||
| Of which:Coal gangue power generation | MW | 32,400 | 35,950 | 10.95 | ||
| Gas-fired | MW | 83,130 | 89,470 | 7.63 | ||
| Of which:Conventional gas | MW | 81,390 | 87,390 | 7.38 | ||
| Coal bed methane power generation | MW | 1,510 | 1,810 | 20.12 | ||
| Oil-fired | MW | 1,700 | 1,710 | 0.35 | ||
| Other | MW | 48,230 | 54,970 | 13.97 | ||
| Of which:Waste heat, gas and pressure | MW | 29,650 | 32,350 | 9.09 | ||
| Waste incineration power generation | MW | 8,890 | 11,710 | 31.69 | ||
| Crop stalk, bagasse, and forestry residue based power generation | MW | 9,690 | 10,920 | 12.67 | ||
| 4. 35 kV and above transmission line length | km | 1,892,018 | 1,975,312 | 4.40 | ||
| 1. Alternating current | km | 1,850,631 | 1,932,947 | 4.45 | ||
| Of which: 1000 kV | km | 11,005 | 10,872 | -1.21 | ||
| 750 kV | km | 20,543 | 23,256 | 13.20 | ||
| 500 kV | km | 187,158 | 195,636 | 4.53 | ||
| 330 kV | km | 30,477 | 32,314 | 6.03 | ||
| 220 kV | km | 434,493 | 454,585 | 4.62 | ||
| 110 kV | km | 652,891 | 684,406 | 4.83 | ||
| 35 kV | km | 514,066 | 531,880 | 3.47 | ||
| 2. Direct current | km | 41,995 | 42,364 | 0.88 | ||
| Of which:±1100 kV | km | 608 | 3,295 | 441.88 | ||
| ±800 kV | km | 21,723 | 21,907 | 0.85 | ||
| ±660 kV | km | 1,334 | 1,334 | |||
| ±500 kV | km | 15,428 | 13,733 | -10.99 | ||
| ±400 kV | km | 1,640 | 1,639 | -0.04 | ||
| 5. 35 kV and above substation capacity | MVA | 6,992,190 | 7,478,330 | 6.95 | ||
| 1. Alternating current | MVA | 6,666,220 | 7,087,180 | 6.31 | ||
| Of which: 1000 kV | MVA | 147,000 | 153,000 | 4.08 | ||
| 750 kV | MVA | 170,300 | 185,150 | 8.72 | ||
| 500 kV | MVA | 1,364,940 | 1,459,050 | 6.89 | ||
| 330 kV | MVA | 131,250 | 140,620 | 7.14 | ||
| 220 kV | MVA | 2,131,270 | 2,261,010 | 6.09 | ||
| 110 kV | MVA | 2,193,790 | 2,350,770 | 7.16 | ||
| 35 kV | MVA | 527,670 | 537,570 | 1.88 | ||
| 2. Direct current | MVA | 331,960 | 377,060 | 13.59 | ||
| Of which:±1100 kV | MVA | 6,000 | 38,390 | 539.89 | ||
| ±800 kV | MVA | 173,610 | 213,450 | 22.95 | ||
| ±660 kV | MVA | 133,530 | 9,470 | 0.03 | ||
| ±500 kV | MVA | 1,410 | 109,450 | -18.03 | ||
| ±400 kV | MVA | 127,850 | 12,450 | 783.11 | ||
| 6. Newly installed generation capacity | MW | 8,590 | 105,000 | -17.87 | ||
| Hydro power | MW | 1,300 | 4,450 | -48.25 | ||
| Of which:Pumped storage | MW | 2,033,520 | 300 | -76.92 | ||
| Thermal power | MW | 43,800 | 44,230 | 0.99 | ||
| Of which:Coal fired | MW | 30,560 | 32,360 | 5.90 | ||
| Gas-fired | MW | 8,840 | 6,300 | -28.67 | ||
| Of which:Conventional gas | MW | 8,810 | 6,290 | -28.63 | ||
| Coal bed methane power generation | MW | 20 | ||||
| Oil | MW | |||||
| Other | MW | 4,400 | 5,570 | 26.47 | ||
| Of which:Waste heat, gas and pressure | MW | 1,980 | 1,660 | -16.08 | ||
| Waste incineration power generation | MW | 1,480 | 2,730 | 84.50 | ||
| Crop stalk, bagasse, and forestry residue based power generation | MW | 940 | 1,180 | 24.54 | ||
| Nuclear power | MW | 8,840 | 4,090 | -53.78 | ||
| Wind power | MW | 21,270 | 25,720 | 20.94 | ||
| Solar power | MW | 45,250 | 26,520 | -41.40 | ||
| Other | MW | 100 | ||||
| 7. Retired and closed down thermal power capacity | MW | 11,970 | 10,240 | -14.44 | ||
| 8. Power generation projects under construction (at year end) by main power companies | MW | 178,900 | 181,920 | 1.69 | ||
| Hydro power | MW | 79,400 | 84,620 | 6.57 | ||
| Thermal power | MW | 69,360 | 54,090 | -22.01 | ||
| Nuclear power | MW | 13,450 | 14,200 | 5.51 | ||
| Wind power | MW | 15,640 | 27,360 | 74.99 | ||
| 9. New DC transmission line and AC converter capacity | ||||||
| 1. Line length | km | 3,325 | ||||
| Of which: ±1100 kV | km | 3,325 | ||||
| ±800 kV | km | |||||
| ±660 kV | km | |||||
| ±500 kV | km | |||||
| ±400 kV | km | |||||
| 2. AC capacity | MW | 32,000 | 22,000 | -31.25 | ||
| Of which: ±1100 kV | MW | 12,000 | 12,000 | |||
| ±800 kV | MW | 20,000 | ||||
| ±660 kV | MW | |||||
| ±500 kV | MW | |||||
| ±400 kV | MW | 10,000 | ||||
| 10. New 110 kV and above AC transmission line length and substation capacity | ||||||
| 1. Line length | km | 56,973 | 57,935 | 1.69 | ||
| Of which: 1000 kV | km | 129 | 2,100 | 1528.27 | ||
| 750 kV | km | 1,573 | 4,406 | 180.10 | ||
| 500 kV | km | 14,540 | 5,595 | -61.52 | ||
| 330 kV | km | 828 | 3,989 | 381.75 | ||
| 220 kV | km | 20,697 | 19,822 | -4.23 | ||
| 110 kV (including 66 kV) | km | 19,206 | 22,023 | 14.67 | ||
| 2. Substation capacity | MVA | 310,240 | 319,150 | 2.87 | ||
| Of which: 1000 kV | MVA | 9,000 | 15,000 | 66.67 | ||
| 750 kV | MVA | 11,400 | 32,450 | 184.65 | ||
| 500 kV | MVA | 11,600 | 86,450 | -22.54 | ||
| 330 kV | MVA | 6,120 | 12,630 | 106.37 | ||
| 220 kV | MVA | 84,020 | 91,610 | 9.04 | ||
| 110 kV (including 66 kV) | MVA | 88,100 | 81,000 | -8.05 | ||
| 11. Completed investment | Million RMB | 816,100 | 829,500 | 1.64 | ||
| 1. Power plant investment | Million RMB | 278,700 | 328,300 | 17.80 | ||
| Hydro power | Million RMB | 70,000 | 83,900 | 19.77 | ||
| Thermal power | Million RMB | 78,600 | 63,400 | -19.41 | ||
| Nuclear power | Million RMB | 44,700 | 38,200 | -14.48 | ||
| Wind power | Million RMB | 64,600 | 124,400 | 92.57 | ||
| Solar power | Million RMB | 20,700 | 18,400 | -11.15 | ||
| Other | Million RMB | |||||
| 2. Electric grid investment | Million RMB | 537,400 | 501,200 | -6.74 | ||
| Transmission and distribution | Million RMB | 513,300 | 477,900 | -6.89 | ||
| Of which:Direct current | Million RMB | 52,000 | 24,900 | -52.06 | ||
| Alternating current | Million RMB | 461,300 | 453,000 | -1.80 | ||
| Other | Million RMB | 24,100 | 23,200 | -3.40 | ||
| 12. Unit capacity in multi-generator power plants, of capacity of 6 MW and above | ||||||
| Hydro power:Single unit capacity | MW/unit | 61 | 60 | -0.06 | ||
| Number of units in fleet | Unit | 4,894 | 5,099 | 4.19 | ||
| Fleet capacity | MW | 298,300 | 307,880 | 3.21 | ||
| Thermal power:Single unit capacity | MW/unit | 134 | 134 | -0.01 | ||
| Number of units in fleet | Unit | 8,070 | 8,430 | 4.46 | ||
| Fleet capacity | MW | 1,079,690 | 1,127,220 | 4.40 | ||
| 13. Heat supply from thermal power plants 6 MW and above | TJ | 4,806,250 | 4,924,920 | 2.47 | ||
| 14. Coal consumption, gross, (as standard coal equivalent) in power plants 6 MW and above | g/kWh | 290 | 289 | -1.15 | ||
| 15. Coal consumption, net, (as standard coal equivalent) in power plants 6 MW and above | g/kWh | 308 | 306 | -1.21 | ||
| 16. Power plant own consumption, plants 6 MW and above | % | 5 | 5 | -0.02 | ||
| Hydro power | % | 0 | 0 | -0.01 | ||
| Thermal power | % | 6 | 6 | 0.06 | ||
| 17. Power plant productivity (full load hours), power plants 6 MW and above | hours | 3,880 | 3,828 | -51 | ||
| Hydro power | hours | 3,607 | 3,697 | 90 | ||
| Of which:Pumped storage | hours | 1,102 | 1,053 | -49 | ||
| Thermal power | hours | 4,378 | 4,307 | -71 | ||
| Nuclear power | hours | 7,543 | 7,394 | -149 | ||
| Wind power | hours | 2,103 | 2,083 | -21 | ||
| Solar power | hours | 1,230 | 1,291 | 61 | ||
| 18. Fuel consumption, power plants 6 MW and above | ||||||
| Standard coal eq. consumed for electric power production | kt | 1,308,050 | 1,320,070 | 0.92 | ||
| Raw coal consumed for electric power production | kt | 1,957,190 | 1,994,430 | 1.90 | ||
| Standard coal eq. consumed for heat production | 万吨 | 18104 | 19463 | 7.50 | ||
| Raw coal consumed for heat production | kt | 275,230 | 292,270 | 6.19 | ||
| 19. Electricity supply, consumption, and transmission losses | ||||||
| Electricity supply | GWh | 5,950,800 | 6,283,500 | 5.59 | ||
| Electricity consumption | GWh | 5,577,700 | 5,911,100 | 5.98 | ||
| Transmission losses | GWh | 373,100 | 372,400 | -0.19 | ||
| Transmission loss rate | % | 6,027 | 6 | -0.34 | ||
| 20. Ratio of capacity of generation : consumption | ||||||
| Installed generation capacity:Total capacity of power consuming equipment | 1:3.96 | 1:4.08 | ||||
| 21. Elasticities of power supply and demand | ||||||
| Elasticity of power supply | 1 | 1 | -38.84 | |||
| Elasticity of power demand | 1 | 1 | -43.02 | |||


