
All translations on this site are unofficial and provided for reference purpose only.
To view translations, select English under Step 1 (at the right of the screen). Not every item is (fully) translated. If you’re still seeing Chinese, you can use machine translation, under Step 2, to make sense of the rest.
Want to help translate? Switch to English under Step 1, and check ‘edit translation’ (more explanation in the FAQ). Even if you translate just a few lines, this is still very much appreciated! Remember to log in if you would like to be credited for your effort. If you’re unsure where to start translating, please see the list of Most wanted translations.
2020 electricity & other energy statistics (preliminary)
Original title: 2020年电力统计年快报基本数据一览表
Links: Source document (in Chinese) (link). Same statistics for (2020) (2019) (2018) (2017) (2016) (2015) (2014) (2013) (2012) (2011) (2010) (2009) (2008) (2007) (2006).
[*: ‘Thermal’ power generation includes coal, gas, oil, and biomass]
2020年电力统计基本数据一览表
| Indicator | Unit | 2019 | 2020 | Change | ||||
| (%) | (±) | (%point) | ||||||
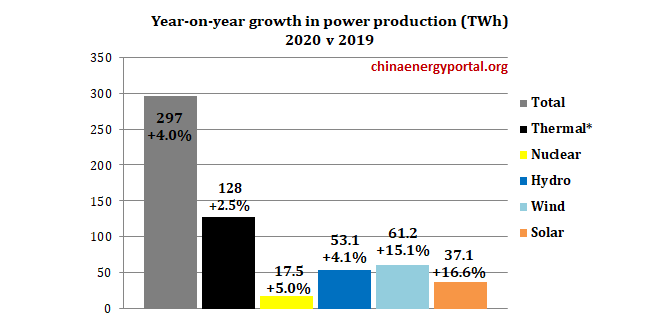
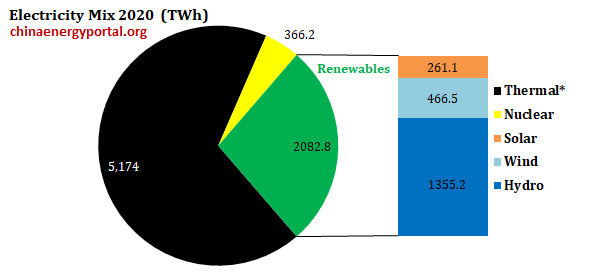
| Power production | GWh | 7,326,900 | 7,623,600 | 4.0 | ||||
| Hydro power | GWh | 1,302,100 | 1,355,200 | 4.1 | ||||
| Thermal power | GWh | 5,046,500 | 5,174,300 | 2.5 | ||||
| Nuclear power | GWh | 348,700 | 366,200 | 5.0 | ||||
| Wind power | GWh | 405,300 | 466,500 | 15.1 | ||||
| Solar power | GWh | 224,000 | 261,100 | 16.6 | ||||
| Total power cons. | GWh | 7,285,200 | 7,511,000 | 3.1 | ||||
| Primary industry | GWh | 77,900 | 85,900 | 10.2 | ||||
| Secondary industry | GWh | 4,996,300 | 5,121,500 | 2.5 | ||||
| Of which:Industry | GWh | 4,907,300 | 5,029,700 | 2.5 | ||||
| Tertiary industry | GWh | 1,186,500 | 1,208,700 | 1.9 | ||||
| Household power cons. | GWh | 1,024,500 | 1,095,000 | 6.9 | ||||
| Installed generation capacity | MW | 2,010,060 | 2,200,580 | 9.5 | ||||
| Hydro power | MW | 358,040 | 370,160 | 3.4 | ||||
| Thermal power | MW | 1,189,570 | 1,245,170 | 4.7 | ||||
| Nuclear power | MW | 48,740 | 49,890 | 2.4 | ||||
| Wind power | MW | 209,150 | 281,530 | 34.6 | ||||
| Solar power | MW | 204,180 | 253,430 | 24.1 | ||||
| Transmission line length (>220 kV) | km | 759,465 | 794,118 | 4.6 | ||||
| Public transformer capacity (>220 kV) | MVA | 4,316,970 | 4,528,100 | 4.9 | ||||
| Newly installed generation capacity | MW | 105,000 | 190,870 | 81.8 | ||||
| Hydro power | MW | 4,450 | 13,230 | 197.7 | ||||
| Thermal power | MW | 44,230 | 56,370 | 27.4 | ||||
| Nuclear power | MW | 4,090 | 1,120 | -72.6 | ||||
| Wind power | MW | 25,720 | 71,670 | 178.7 | ||||
| Solar power | MW | 26,520 | 48,200 | 81.7 | ||||
| Transmission line length (>220 kV), additions | km | 35,912 | 35,029 | -2.5 | ||||
| Newly installed converter capacity | MW | 22,000 | 52,000 | 136.4 | ||||
| Substation capacity (>220 kV), additions | MVA | 238,140 | 222,880 | -6.4 | ||||
| Completed investment in electric power projects | Million RMB | 907,200 | 994,400 | 9.6 | ||||
| Of which:Completed investment in power generation | Million RMB | 406,000 | 524,400 | 29.2 | ||||
| Of which:Hydro power | Million RMB | 90,500 | 107,700 | 19.0 | ||||
| Thermal power | Million RMB | 76,000 | 55,300 | -27.3 | ||||
| Nuclear power | Million RMB | 48,800 | 37,800 | -22.6 | ||||
| Wind power | Million RMB | 153,500 | 261,800 | 70.6 | ||||
| Of which:Completed investment in power grid | Million RMB | 501,200 | 469,900 | -6.2 | ||||
| Coal consumption, net, (as standard coal equivalent) in power plants 6 MW and above | g/kWh | 306.4 | 305.5 | -0.9 | ||||
| Power plant productivity (full load hours; 6 MW+ power plant avg.) | hours | 3,828 | 3,758 | -70 | ||||
| Hydro power | hours | 3,697 | 3,827 | 130 | ||||
| Thermal power | hours | 4,307 | 4,216 | -92 | ||||
| Nuclear power | hours | 2,083 | 7,453 | 59 | ||||
| Wind power | hours | 2,083 | 2,073 | -10 | ||||
| Transmission loss rate | % | 5.93 | 5.62 | -0.31 | ||||
Note:1. Power production, total electricity consumption and generation capacity data are industry statistics totals from the China Electricity Council。
2. Wind and solar power generation and generation capacity statistics are for grid-connected capacity。
3. Due to differences in statistical standards, confirmation of moment of grid connection, and other reasons, there are certain discrepancies in data on total and newly installed generation capacity。
4. Data for "Completed investment in electric power projects" is from completed investment by large power companies as included in the CEC Power Industry Statistics;
5. Where there are whitespaces in the above table, it indicates that the statistical data was either below the minimum unit of reporting used in this table, or unknown, or not available。
Additional statistics from NBS:
Original title: 2020年12月份规模以上工业增加值增长7.3%
Links: Source document (in Chinese) (link).
2020年12月份规模以上工业生产主要数据
| January-December | |||
| Amount | YoY Increase | ||
| (%) | |||
| Vehicles | 1000 units | 24,625 | -1.4 |
| Of which:Sedan | 1000 units | 9,286 | -8.3 |
| Sport utility vehicles (SUV) | 1000 units | 8,532 | 1.5 |
| Of which:“New Energy Vehicles" | 1000 units | 1,456 | 17.3 |
| Generators (power generation equipment) | MW | 141,680 | 30.3 |
| Raw coal | kt | 3,843,740 | 0.9 |
| Coking coal | kt | 471,160 | 0.0 |
| Crude oil | kt | 194,920 | 1.6 |
| Crude oil processing capacity | kt | 674,410 | 3.0 |
| Natural gas | Million cubic meter | 188,800 | 9.8 |


